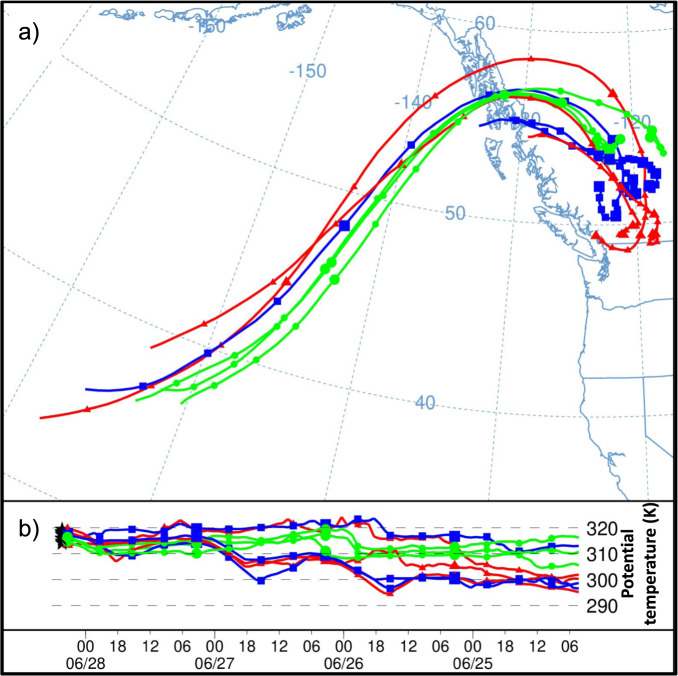
Fig. 4. Back-trajectories for Near-surface Heatwave Air.
a Nine representative four-day backward trajectories terminating at 500 m above ground level (AGL) within the strongest heat anomaly (boxed area in Fig. 1a). b Potential temperature of parcels along the trajectory, time from right to left. Potential temperature changes indicate diabatic heating/cooling. Small (large) markers indicate every 6 (24) h, and colors correspond to the trajectory terminating latitude. Trajectories were computed and plotted using GFS 0.25° forecast data and the NOAA HYSPLIT model.

