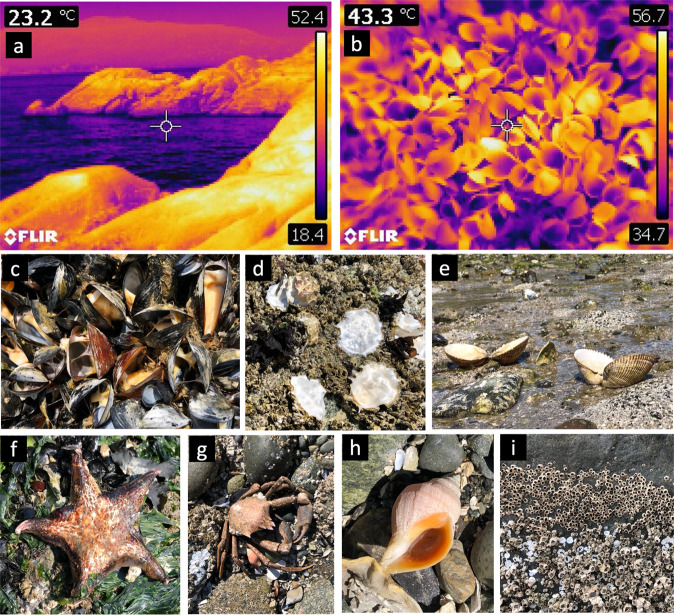
Fig. 6. Heatwave impacts on marine life.
Thermal images showing extreme high surface temperatures during low tide on 28 June, 2021, on a a rocky intertidal shoreline and b within a mussel bed. Scale bars indicate the range in temperature from the coolest to warmest parts of the image, while the value at the upper left indicates the temperature in the cross-hairs at center. Note that the mussels in b have died and are gaping open. A subset of species impacted by the heatwave are shown in c–i, including c bay mussels, Mytilus trossulus, d Pacific oysters, Magallana (= Crassostrea) gigas, e heart cockles, Clinocardium nuttallii, f leather stars, Dermasterias imbricata, g kelp crabs, Pugettia producta, h dogwhelks, Nucella lamellosa, and i barnacles, Chthamalus dalli (upper portion of image) and Balanus glandula (lower portion of image). See Methods for locations and dates of photos in c–i.

