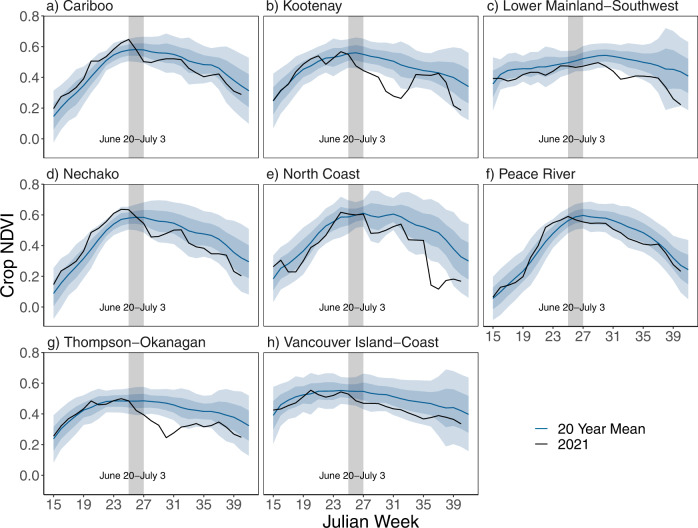
Fig. 8. Heatwave impacts on crop health.
Weekly Normalized Difference Vegetation Index (NDVI) from the Crop Condition Assessment Program (see Methods), spatially averaged over agricultural divisions in British Columbia, organized alphabetically. 2021 values are shown in the black line, with the 2000–2020 climatology in blue and shading showing interannual variability for this 2000–2020 period (±1 and 2 standard deviations). The gray highlighted region shows the heatwave period, 20 June—3 July; data are reported as weekly averages and so the heatwave is split between weeks 20–26 June and 27 June—3 July. The locations of the 8 agricultural divisions are shown in Fig. 1a in gray contours.

