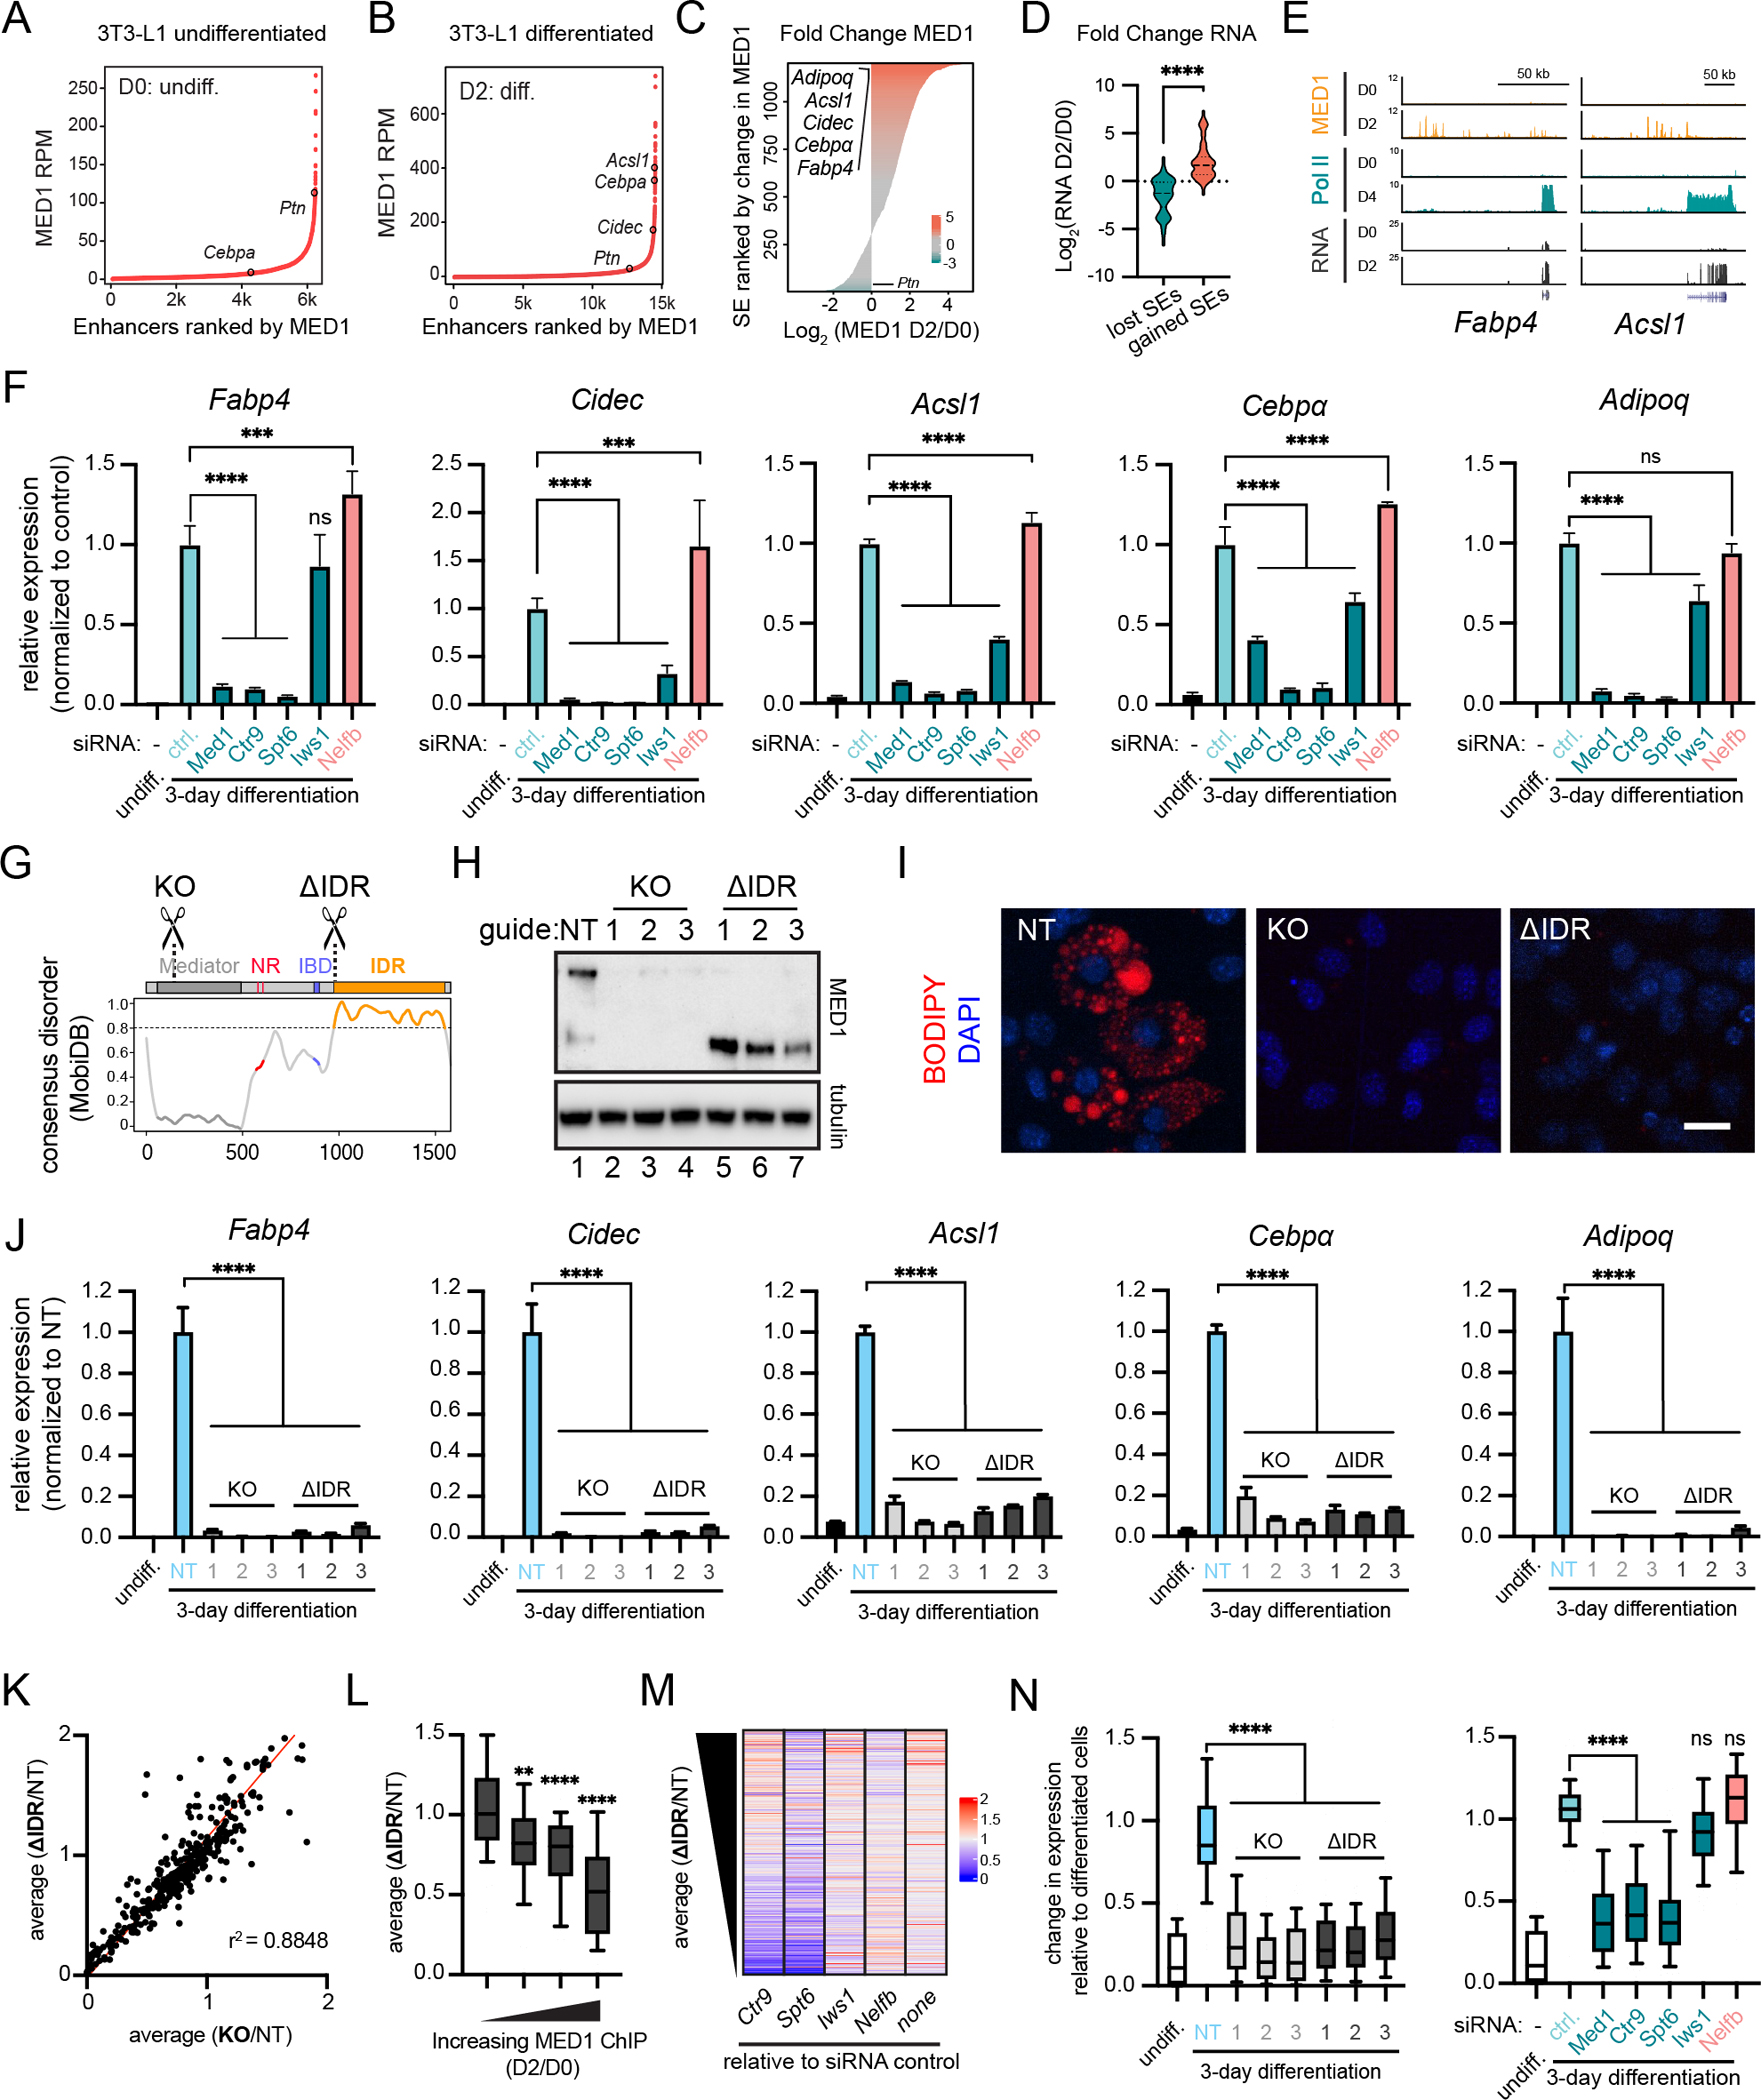
Figure 3. MED1IDR is required for gene activation during a cell-state transition.

A) Rank ordered plot of enhancers in untreated 3T3-L1 cells (Day 0, D0) ranked by increasing MED1 ChIP-seq signal (RPM).
B) Same as 3A, but for 3T3-L1 cells after 2 days (D2) of differentiation.
C) Horizontal bar plot of all genomic regions containing a super-enhancer at D0 or D2 ranked by log2 (MED1_D2/MED1_D0).
D) Violin plots of the log2 fold change in RNA expression for the genes proximal to top 100 and bottom 100 super-enhancers from Figure 3C. p-values, t-test.
E) Gene tracks of MED1 and RNA Pol II ChIP-seq, and RNA-seq from 3T3-L1 cells.
F) Relative expression of adipocyte genes after knockdown of the indicated transcriptional regulators. Mean±SD. p-values, one-way ANOVA vs control.
G) Location of sgRNAs for MED1 knockout (KO) and MED1ΔIDR (ΔIDR) cell lines. See also Figure S3H.
H) Immunoblot for N-terminal epitope of MED1 in 3T3-L1 CRISPR-Cas9 engineered cells.
I) Images of CRISPR-Cas9 engineered cell lines stained with BODIPY and DAPI (nuclei). Scale, 20μm.
J) Relative expression of adipocyte genes. Mean±SD. p-values, one-way ANOVA vs NT.
K) Scatter plot of average FPKM from either the three ΔIDR cells (y-axis) or the three KO cells (x-axis) each divided by FPKM from the NT cells for all adipocyte-activated genes. r2 = goodness-of-fit for a linear regression.
L) Adipocyte-activated genes with annotated MED1-occupied enhancers were ranked by the fold increase from D0 to D2 and split into 4 equal bins. Boxplot(10–90%) of average(ΔIDR/NT) for each bin. p-values, one-way ANOVA vs first bin.
M) Heatmap of fold change in FPKM for the indicated knockdowns (X-axis labels) relative to the siRNA control (“none”) ranked by decreasing average(ΔIDR/NT). See also Fig S3O.
N) Boxplot(10–90%) showing FPKM of KO or ΔIDR samples (left) or siRNA experiments (right) relative to FPKM of control day-3 differentiated cells for adipocyte-activated genes sensitive to deletion of MED1IDR (ΔIDR/NT ≤ 0.5). p-values, one-way ANOVA vs NT (left) or ctrl (right).
See also Figure S3.
