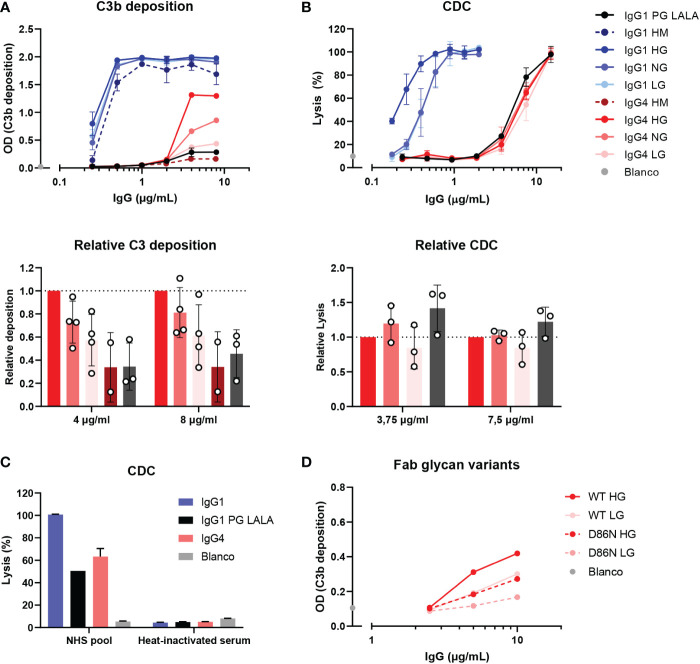
Figure 3.
IgG4 glycovariants can induce C3b deposition to different extent. (A) C3b deposition induced by anti-biotin IgG1 and IgG4 glycovariants (high mannose (HM), high galactose (HG), normal galactose (NG) and low galactose (LG)), and IgG1 PG-LALA in the presence of biotinylated human serum albumin (240 μM biotin) and 2.5% human serum. Relative C3b deposition of the IgG4 glycovariants at concentrations 4 µg/mL and 8 µg/mL was normalized to IgG4 HG, which was set to 1 (dashed line), is shown as bar graphs. (B) Percentage of complement-mediated lysis of biotinylated human red blood cells (2.5 mM biotin) by the anti-biotin IgG1 and IgG4 glycovariants. The percentage of lysis was calculated based on the 100% lysis control (red blood cells with saponin). The percentage of complement-mediated lysis of the IgG4 glycovariants at concentrations 3.75 µg/mL and 7 µg/mL normalized to IgG4 HG is shown as bar graphs. Kruskal-Wallis test with Dunn’s multiple comparisons test of the IgG4 glycovariants was performed. (C) To test unspecific complement-dependent cytotoxicity (CDC), anti-biotin IgG1, IgG4 and IgG1 PG-LALA (eliminated Fc-mediated effector functions) were tested in the presence of biotinylated RBCs and 10% normal or heat-inactivated human serum. (D) C3b deposition induced by anti-trinitrophenyl (TNP) IgG4 glycovariants variants (HG and LG), which were produced as wild type IgG4, and a variant with D86N substitution in the light chain to introduce an additional glycosylation site in the Fab region. All experiments were performed at least three times, shown are representative figures for the C3b deposition and the mean ± standard deviation for the lysis experiments.

