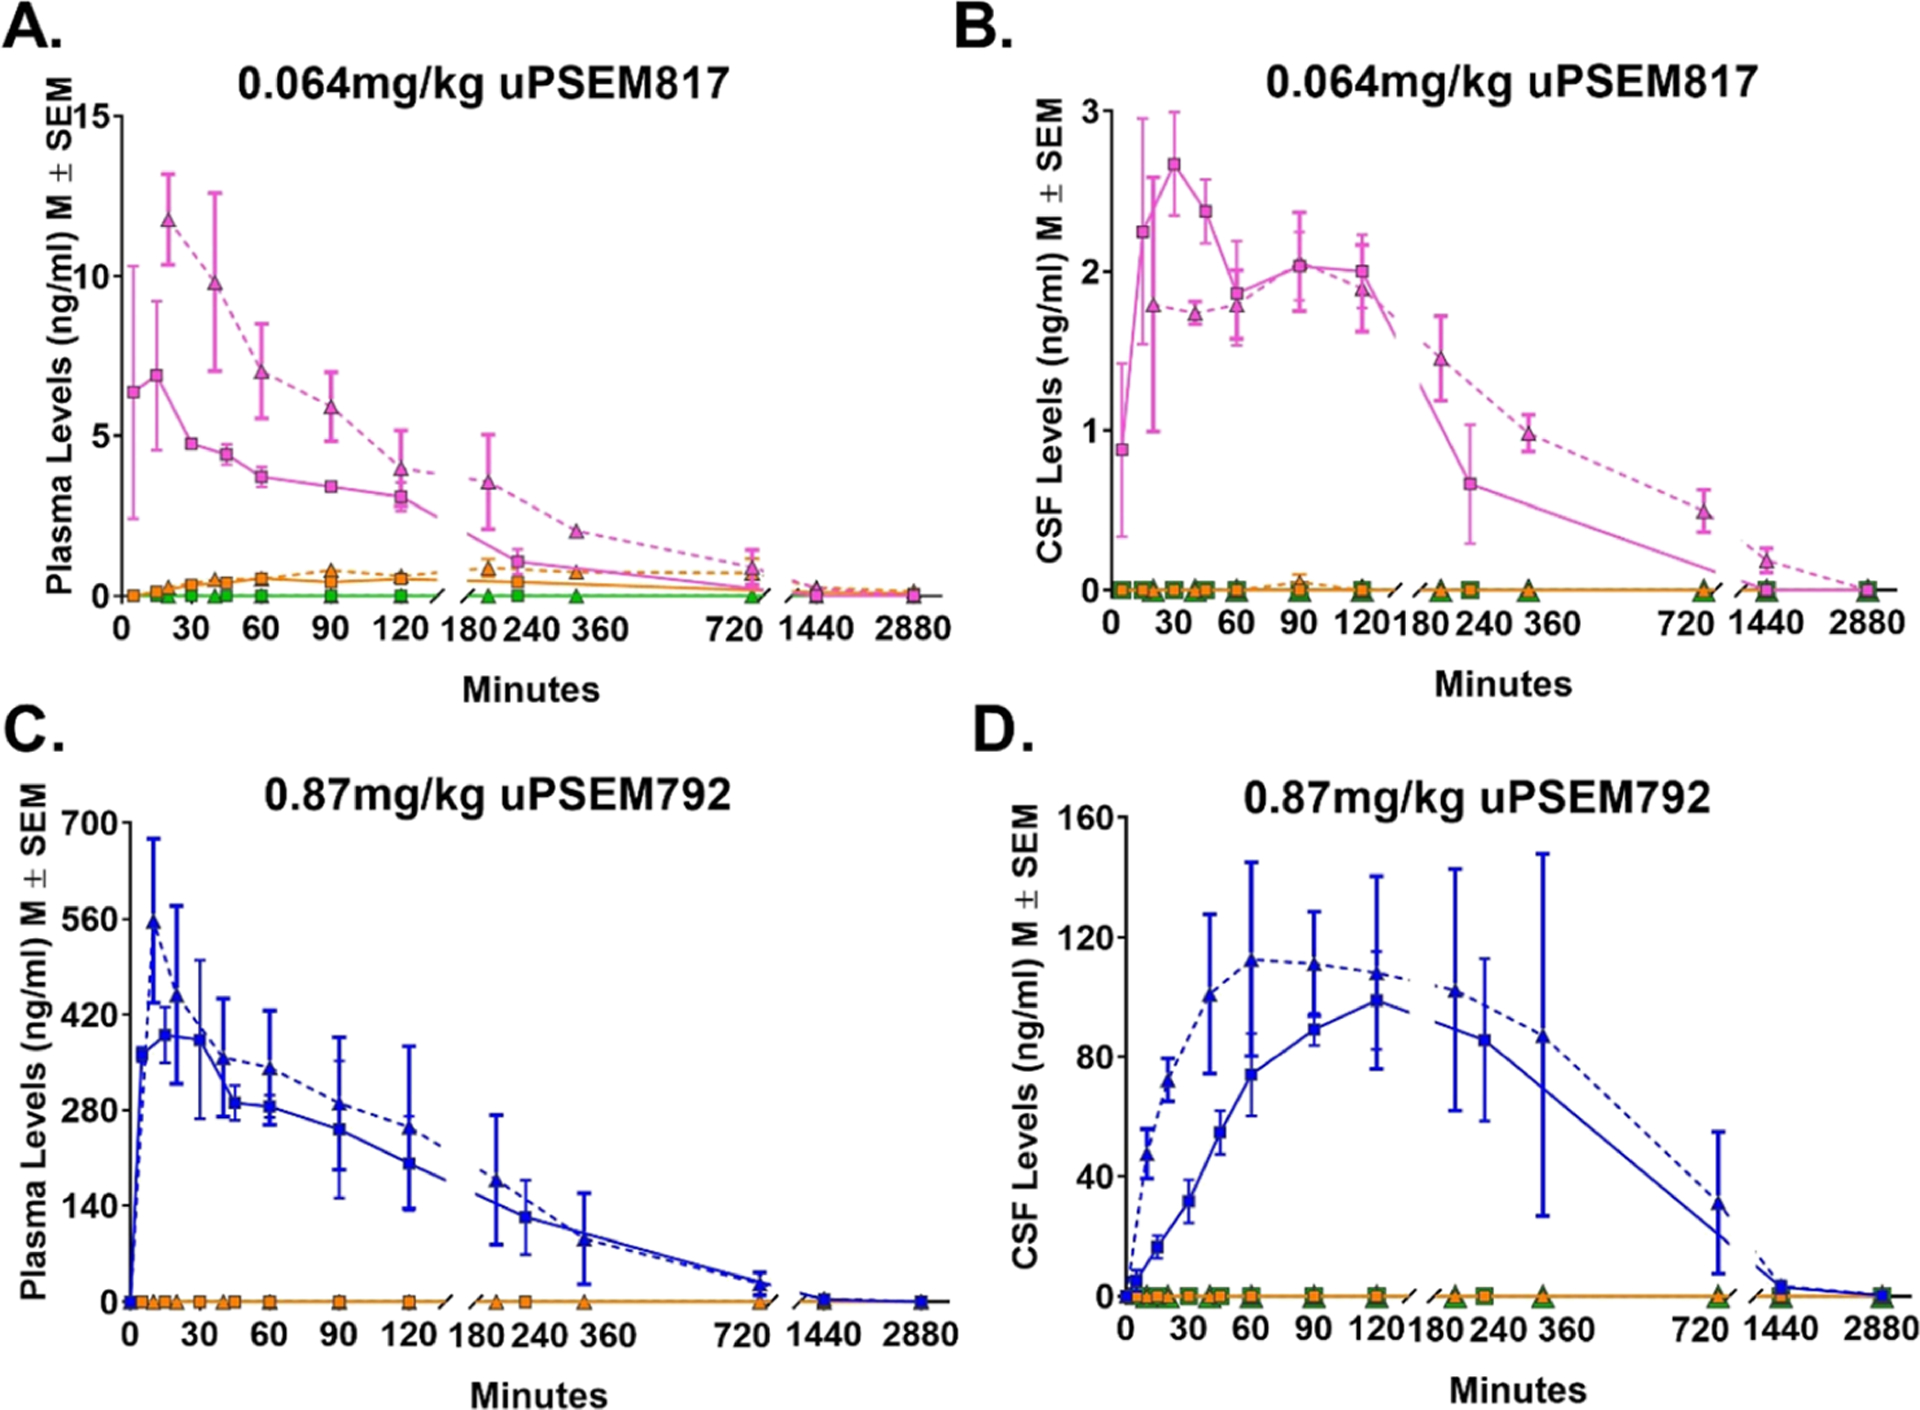
Figure 1.

Time–concentration profiles of uPSEMs and metabolites. Levels of uPSEM817 (pink) and metabolites, hydroxyvarenicline (orange) or varenicline (green), in plasma (A) and CSF (B) after an intravenous (i.v.; triangle with dashed line; n = 2 rhesus monkeys) or subcutaneous (s.c.; square with solid line; n = 5 rhesus monkeys) administration of 0.064 mg/kg dose of uPSEM817. Panels C and D illustrate the levels of uPSEM792 (blue) and metabolites in plasma (C) and CSF (D) after i.v. or s.c. administration of 0.87 mg/kg dose of uPSEM792 in two rhesus monkeys.
