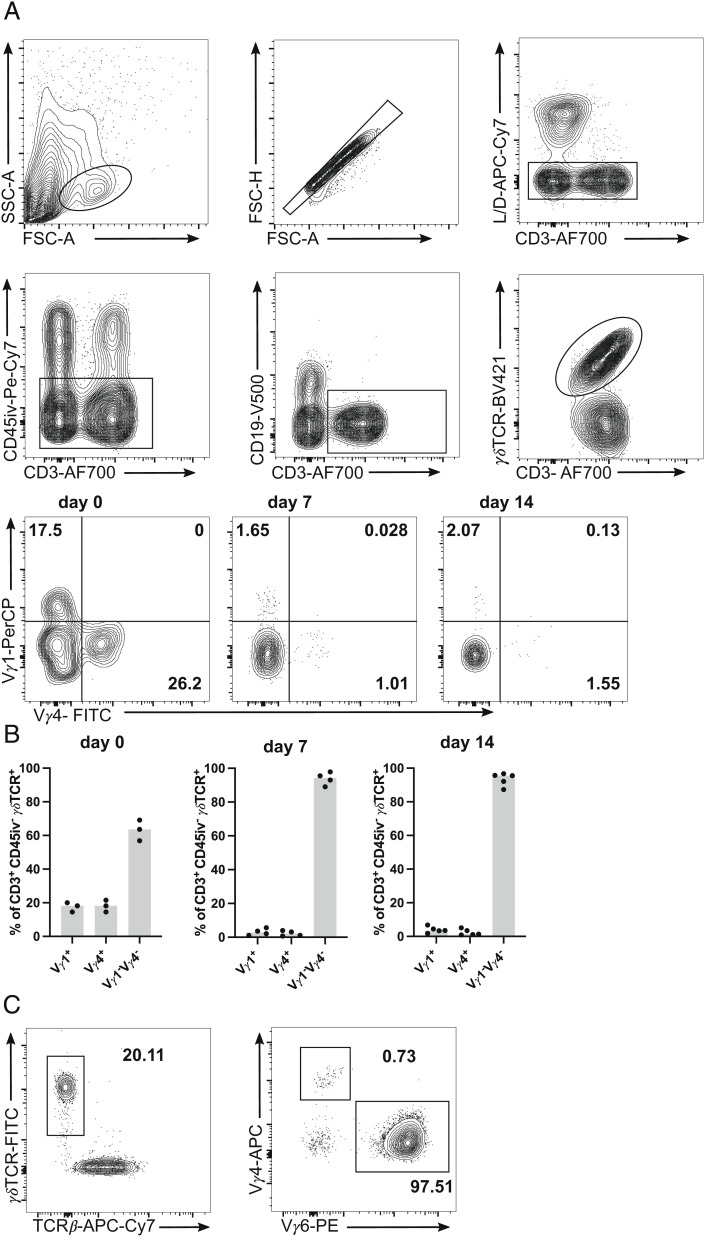
Fig. 2.
Vγ repertoire of renal γδ T cells. C57BL/6 mice were infected i.v. with 107 CFU of S. aureus or remained without infection. At the indicated time points, leukocytes were isolated from the kidney, and directly analyzed by flow cytometry. Three minutes prior to collecting organs, mice received i.v. fluorochrome-conjugated anti-CD45 mAb to label vascular cells. (A) Renal γδ T cells were identified as CD45iv− CD3+ γδTCR+ cells and analyzed Vγ1 and Vγ4 expression. Gating strategy for renal γδ T cells and representative dot plots for Vγ1 and Vγ4 staining of γδ T cells. (B) Percentages of renal Vγ1+, Vγ4+, and Vγ1−Vγ4− γδ T cells. (C) Representative dot plots for Vγ4 and Vγ6 staining of renal γδ T cells. Results in (B) are representative of one of two independent experiments with three to five animals per time point. Symbols represent individual mice and bars show median values.

