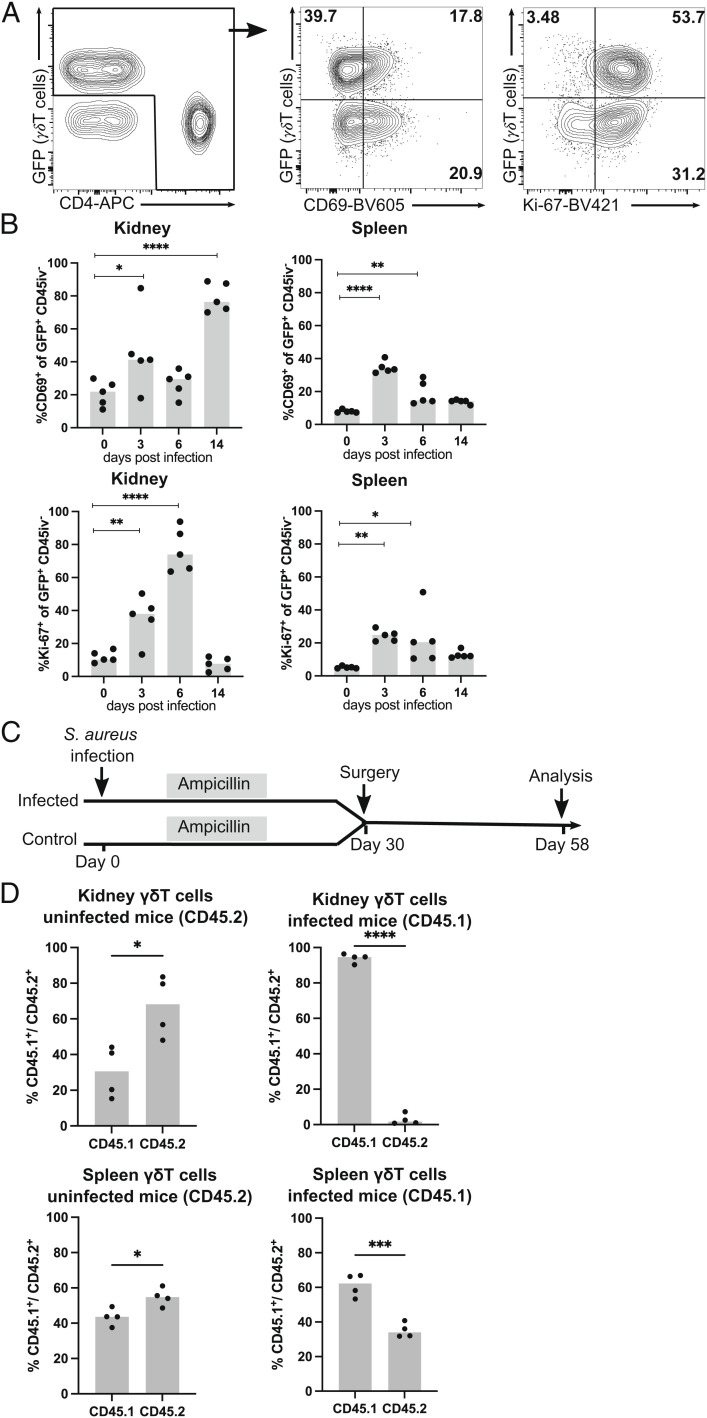
Fig. 3.
After S. aureus infection, renal γδ T cells proliferate and acquire a tissue-resident phenotype. (A, B) TCRdH2BeGFP mice were infected with 107 CFU of S. aureus or remained without infection. γδ T cells from the spleen and kidney were isolated and analyzed directly by flow cytometry. Three minutes prior to collecting organs, mice received i.v. fluorochrome-conjugated anti-CD45 mAb to label vascular cells. (A) Representative anti-CD4 and GFP staining of renal CD45iv− CD3+ T cells (Left) at day 6 p.i. and of CD69 (Middle) and Ki-67 (Right) expression of gated CD4+ (Lower Quadrants) and γδ T cells (Upper Quadrants). (B) Percentages of CD69+ and of Ki-67+ GFP+ γδ T cells in the spleen and kidney analyzed at the indicated days p.i. Results are from one of two independent experiments with four to five animals per time point. (C, D) CD45.1 mice were infected with S. aureus. After 2 wk, infected and CD45.2 control mice were treated with ampicillin. On day 30 p. i., infected and control mice were surgically joined, and after further 28 d, mice were killed and cells in the spleen and kidney were analyzed. (C) Experimental scheme. (D) Percentages of CD45.1+ and CD45.2+ γδ T cells in the spleen and kidney of mice with and without prior S. aureus infection. Symbols represent individual mice and bars show the median. Statistical analysis was performed with one-way ANOVA test and Dunnett’s multiple comparisons posttest (B) or with Student t test (D).

