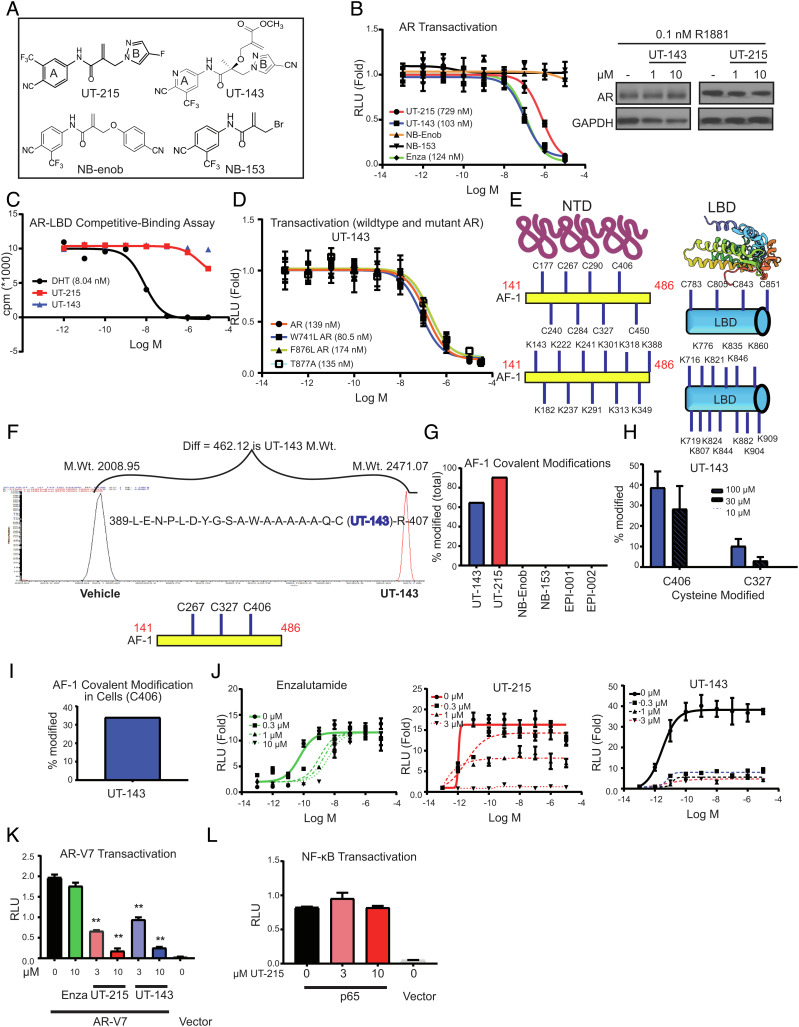
Fig. 2.
Discovery and characterization of SARICAs. (A) Chemical structures. (B) AR transactivation. COS7 cells plated in 24-well plates in DME + 5% csFBS without phenol red were transfected in quadruplicates with 0.25 µg GRE-LUC, 0.025 µg CMV-hAR, and 0.01 µg CMV-renilla-LUC. Cells in DME + 5% csFBS without phenol red were treated 24 h after transfection with a dose–response of the indicated compounds in the presence of 0.1 nM R1881. Dual luciferase assay was performed 24 h after treatment, and firefly luciferase values were normalized to renilla luciferase values. The data are average and SE of three biological replicates each performed in quadruplicates. Western blot. LNCaP cells maintained in 1% csFBS-containing medium for 2 d were treated with the compounds in the presence of 0.1 nM R1881. Cells were harvested 24 h after treatment, and the protein extracts were immunoblotted for AR and GAPDH. Representative blot is shown. (C) Competitive ligand-binding assay. Recombinant human AR-LBD protein (unpurified crude prep) was incubated with a dose–response of the indicated compounds in the presence of 6 nM 3H R1881 for 16 to 20 h. The 3H-bound protein captured by hydroxyapatite was washed to remove unbound radioactivity, and the bound 3H was counted using a scintillation counter. (D) Mutant AR transactivation. Transactivation assay was performed as indicated above with wild-type AR in the presence of 0.1 nM R1881 or mutant ARs in the presence of 0.3 nM R1881. The data are average and SE of three biological replicates each performed in quadruplicates. (E) Structure of AR NTD and LBD (for illustration purpose only) and the location of cysteines and lysines in the AF-1 and LBD (uniprot: P10275). (F) Mass Spectrometry profile and an example binding peptide sequence. Purified recombinant AR AF-1 protein (10 µg) was incubated in the presence or absence of 100 µM SARICAs for 12 to 16 h at 4 °C. Protein was digested with trypsin overnight at 4 °C, and the peptides were identified by mass spectrometry. An example peptide, its modification, and molecular weight shift by a SARICA are shown. The three modified amino acids C406 > C326 > C267 are shown below the Mass spectrometry profile. X-axis is m/z. (G) Quantification of modified AF-1. Mass spectrometry experiments were performed as indicated above with 100 µM indicated compounds. Percentage of the peptides covalently modified relative to unmodified peptides by various compounds was calculated and represented as bar graph (representative of n = 3 to 5). (H) Mass spectrometry experiment with dose–response of UT-143. Mass Spectrometry experiments were performed as indicated above with a dose–response of the compounds. Percentage of C406 and C327 modified is represented (n = 3 to 5). (I) Covalent modification in cells. COS7 cells were transfected with gal-4-AF-1. Cells were treated with 30 µM UT-143 in DME + 10%FBS for 2 h. AF-1 was immunoprecipitated with Gal-4 antibody, trypsinized, and mass spectrometry was performed. Percent-modified C406 AF-1 peptide is shown. (J) Schild plot for AR transactivation. COS7 cells were transfected in quadruplicates as indicated above. Cells in DME + 5% csFBS without phenol red were treated with a dose–response (1 pM to 10 µM) of R1881 in the presence or absence of the indicated doses of various compounds. Dual luciferase assay was performed 24 h after treatment. (K) SARICAs inhibit AR-V7 transactivation. COS7 cells in triplicates were transfected with 0.25 µg GRE-LUC, 0.025 µg pCDNA3.1 AR-V7 or vector, and 0.01 µg CMV-renilla LUC. Cells in DME + 10% FBS were treated 24 h after transfection, and luciferase assay was performed 48 h after transfection (n = 3). A representative of three independent experiments is shown. (L) The experiment was conducted as shown for AR-V7 with p65 and NFkB-LUC transfected instead of AR-V7 and GRE-LUC (n = 3). Numbers shown in graphs are IC50 values. RLU – relative light units; SARICA – selective AR irreversible covalent antagonist. AF-1 – activation function-1 domain; AR – androgen receptor; LBD- ligand-binding domain; GST – glutathione S transferase; C – cysteine; K – lysine; A – alanine. Values represented in bar graphs are average ± SE.

