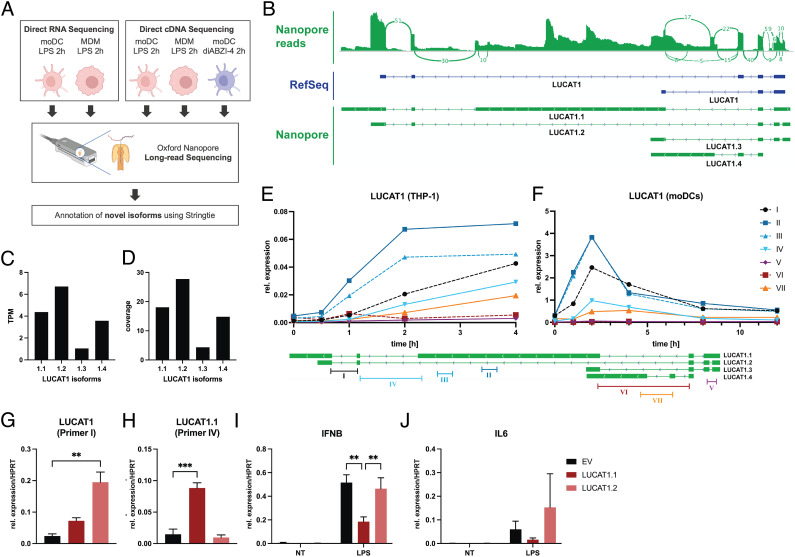
Fig. 2.
LUCAT1 isoforms determined by long-read sequencing. (A) Schematic of long-read nanopore sequencing that was used to determine isoforms of LUCAT1. (B) Combined reads from sequencing (Top), reference annotation from RefSeq (Middle), and isoforms with highest expression levels from annotation based on sequencing results (Bottom). (C and D) TPM and coverage for isoforms shown in B. (E and F) Relative expression levels at different time points after LPS stimulation using primers targeting isoforms of LUCAT1 from B in THP-1 cells (E) and moDCs (F) were measured by qRT-PCR. Data are from three independent experiments in E or three different healthy donors in F (n = 3). Primer locations relative to LUCAT1 isoforms are shown at the bottom. (G–J) Relative expression levels of LUCAT1 using primer I (G) and primer IV (H), IFNB (I), and IL6 (J) in THP-1 cells that have been transduced with an empty vector control (EV) or vectors encoding transcripts LUCAT1.1 or LUCAT1.2 have been measured by qRT-PCR. Cells have been left untreated (NT) or stimulated with 200 ng/mL LPS for 2 h. Data are from three independent experiments (n = 3). Data are represented as mean (E and F) or mean ± SEM (G–J). P values (**P ≤ 0.01, ***P ≤ 0.001) have been determined by one-way or two-way ANOVA in G–J. NT: not treated.

