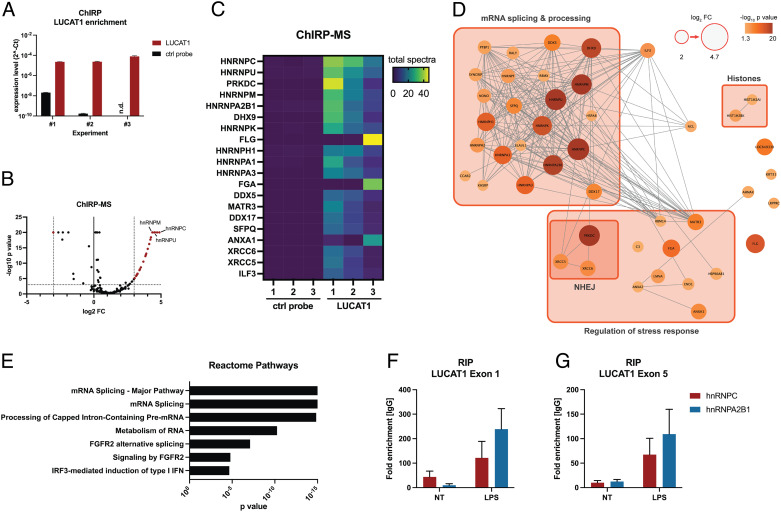
Fig. 3.
LUCAT1-interacting proteins determined by ChIRP-MS. (A) LUCAT1 enrichment in ChIRP pulldown samples was determined by qRT-PCR for LUCAT1-binding and control probe. Data are from two technical replicates and three independent experiments in total (n = 3). (B–D) LUCAT1-binding proteins were determined by mass spectrometry and are presented as volcano plot (B), heatmap (C), and interaction map (D). Grouping of proteins in D is based on GO term analysis. (E) Reactome pathway analysis based on enriched LUCAT1-binding proteins with log2 FC ≥ 2 and p value ≤ 0.05. (F and G) LUCAT1 levels determined for RIP with hnRNP C and A2B1 relative to IgG control antibody in moDCs. LUCAT1 levels were determined by qRT-PCR for exon 1 (F) and exon 5 (G). Data are from three to four different healthy donors (n = 3 to 4). (A, F, and G) Data are represented as mean ± SEM. P values have been determined by Fisher’s exact test in B and D. NT: not treated; n.d.: not detectable.

