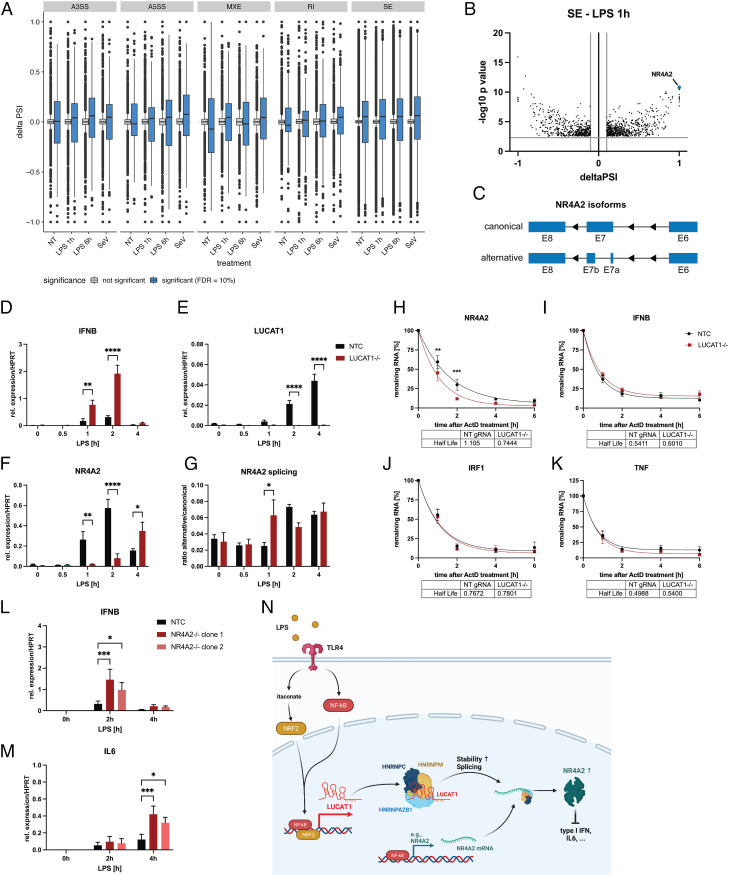
Fig. 4.
LUCAT1-deficient cells demonstrate altered splicing patterns and NR4A2 levels. (A and B) Alternative splicing events in THP-1 LUCAT1−/− vs. control cells (non-targeting gRNA) either left untreated (NT) or stimulated with 200 ng/mL LPS for 1 h or 6 h or infected with Sendai Virus (SeV) for 6 h. Alternative splicing events A3SS (alternative 3′ splicing site), A5SS (alternative 5′ splicing site), MXE (Mutually exclusive exon), RI (retained intron), and SE are shown in A. Individual SE events after 1 h LPS treatment are shown in B. Data are from two independent experiments (n = 2). (C) Schematic showing alternatively spliced NR4A2 mRNA at exon 7. (D–G) Relative expression of IFNB (D), LUCAT1 (E), and NR4A2 (F) as well as the ratio of NR4A2 alternative to canonical transcript (G) in THP-1 non-targeting gRNA (NTC) and LUCAT1−/− cells treated for different time points with 200 ng/mL LPS. Data are from five independent experiments (n = 5). (H–K) Analysis of mRNA stability of NR4A2 (H), IFNB (I), IRF1 (J), and TNF (K) by qRT-PCR using ActD treatment for 0 to 6 h. THP-1 gRNA (NTC) and LUCAT1−/− cells were stimulated with 200 ng/mL LPS for 4 h before ActD was added. Data are from four independent experiments (n = 4). (L and M) Relative expression of IFNB (L) and IL6 (M) for THP-1 gRNA (NTC) and two different NR4A2−/− clonal cell lines (clone 1 and clone 2) was measured by qRT-PCR. Cells were left untreated (NT) or stimulated with 200 ng/mL LPS for 2 h and 4 h. Data are from three independent experiments (n = 3). (N) Schematic figure showing potential molecular mechanism of LUCAT1-dependent regulation of immune response. (D–M) Data are represented as mean ± SEM. P values (*P ≤ 0.05, **P ≤ 0.01, ***P ≤ 0.001, ****P ≤ 0.0001) were determined by two-way ANOVA in D–M. NT: not treated.

