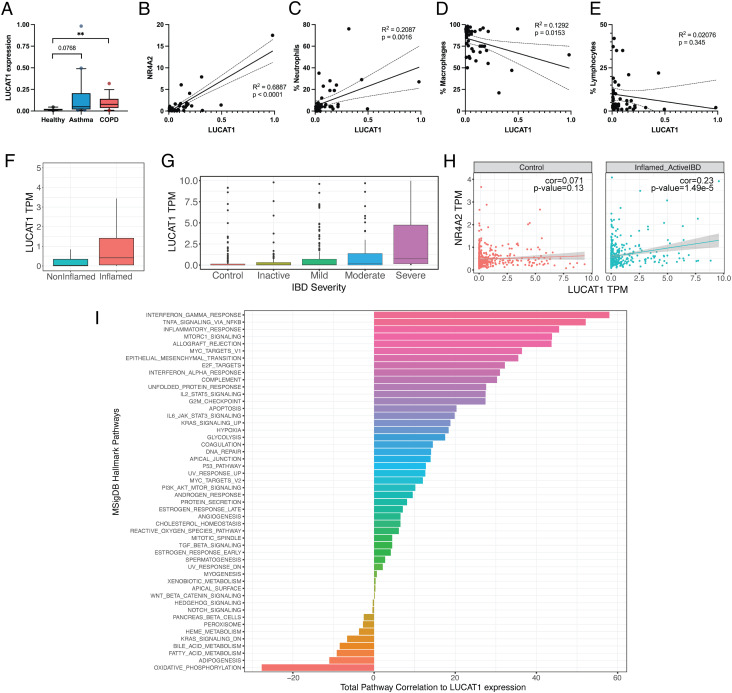
Fig. 5.
LUCAT1 expression is increased in COPD and IBD and correlates with disease severity. (A) LUCAT1 expression in BAL samples from healthy (n = 10), asthma (n = 20), and COPD (n = 15) patients was measured by qRT-PCR. (B–E) Correlation of LUCAT1 levels with NR4A2 levels (B), fraction of neutrophils (C), macrophages (D), and lymphocytes (E) in BAL. (F and G) LUCAT1 expression levels shown as transcript per million (TPM) in IBD patients separated by inflamed vs. non-inflamed (F) or based on disease severity in G. (H) Correlation of LUCAT1 and NR4A2 in patients from non-inflamed tissue (Left) or active IBD (Right) is shown. (I) Total correlation of LUCAT1 expression with the gene sets from the Hallmark Pathways collection from MSigDB. Data are represented as box plot (box: median + 25 to 75 percentile; whiskers: 10 to 90 percentile) in A and individual points and linear regression curves are shown in B–E. (A): two-tailed Student’s t test. **P ≤ 0.01

