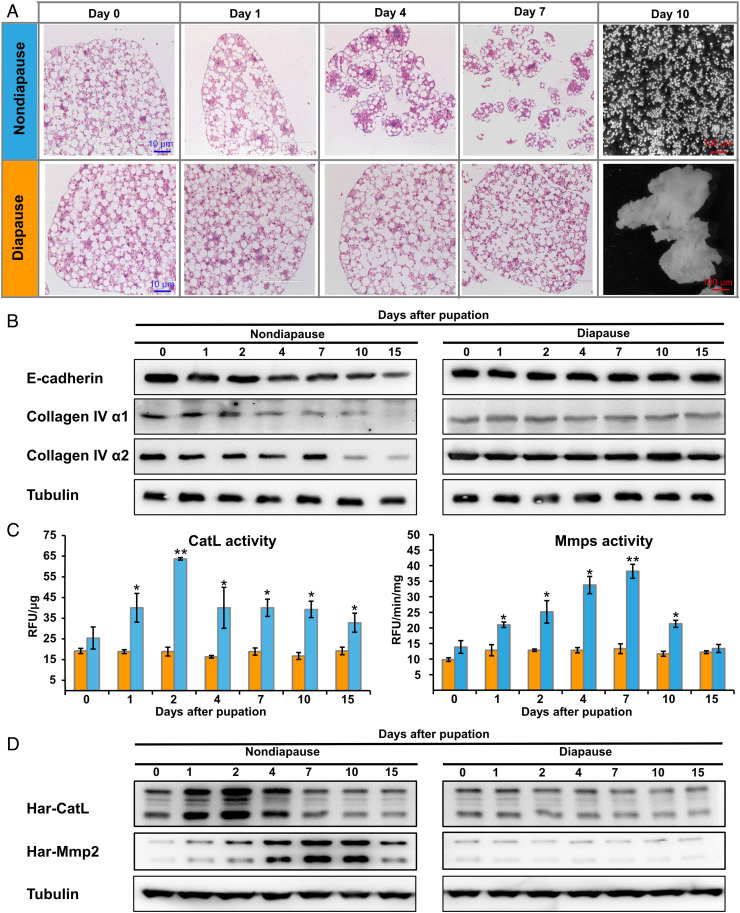
Fig. 1.
A comparison of fat body cell dissociation between nondiapause and diapause pupae from 0 to 15 d after pupation. (A) Histological sections and H&E staining analysis of morphological changes. (B) Western blot showing patterns of degradation for three ECM protein components (E-cadherin, Collagen IV α1, and Collagen IV α2). (C) Developmental changes in the enzymatic activity of two ECM proteinases (CatL and Mmps). Bars represent the mean ± SEM. Significant differences were calculated using Student’s t test (*P < 0.05; **P < 0.01) according to three biological replicates. (D) Western blot showing changes in Har-CatL and Har-Mmp2 protein levels.

