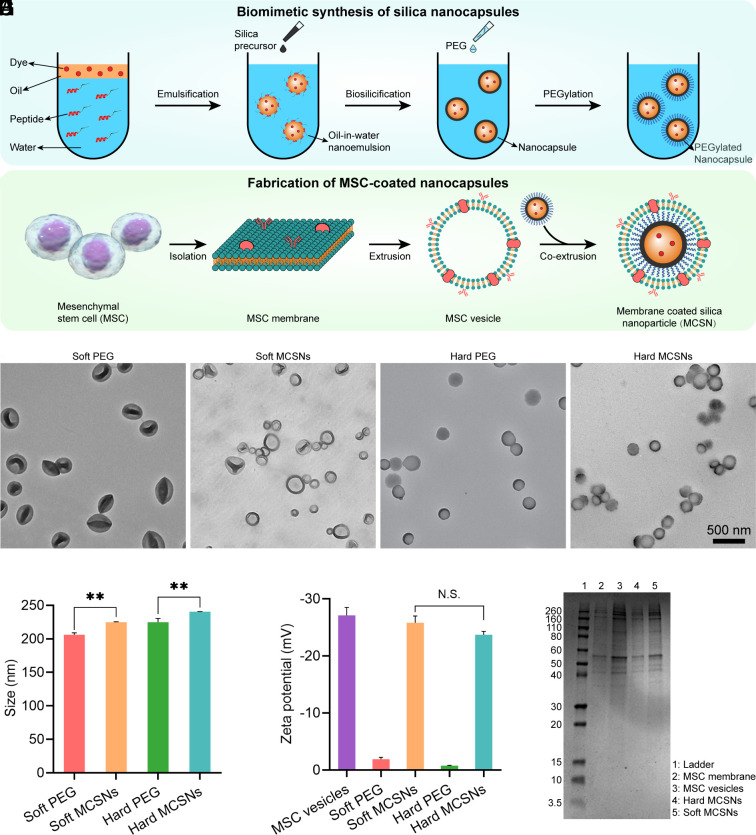
Fig. 1.
Synthesis of MCSNs and their characterization. (A) Schematic illustration of the fabrication of SNs. (B) Synthesis of MCSNs. (C–F) TEM images of PEGylated soft SNs, soft MCSNs, PEGylated hard SNs, and hard MCSNs, respectively. Samples of B and D were negatively stained with uranyl acetate. (Scale bar, 500 nm.) (G) Particle size of different NPs (n = 3; mean ± SD). (H) Zeta-potential of different NPs (n = 3; mean ± SD). (I) SDS–PAGE of the protein profile. From Left to Right were i) ladder, ii) isolated MSC membrane, iii) MSC membrane formed vesicles, iv) hard MCSNs, and v) soft MCSNs.

