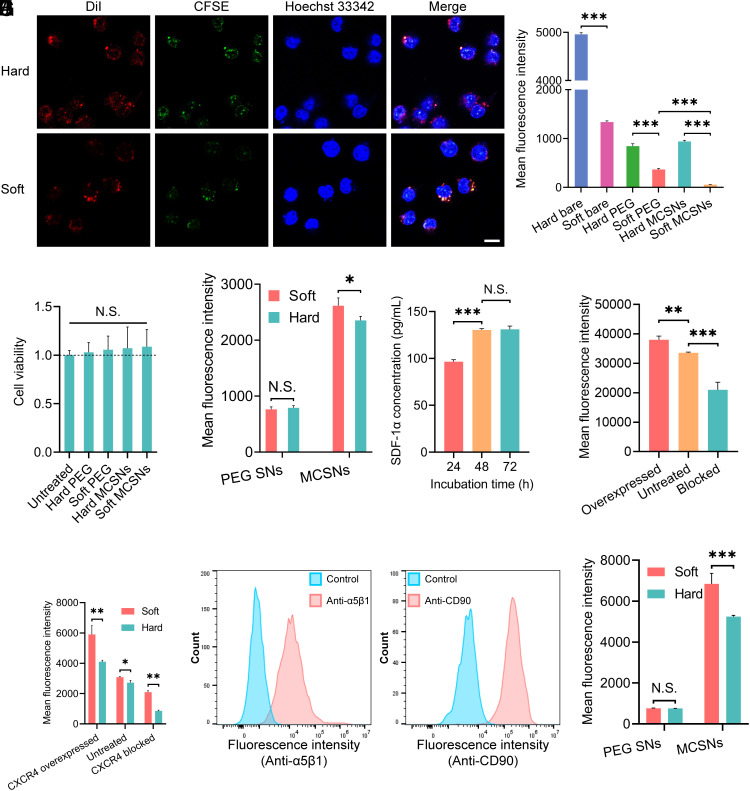
Fig. 2.
The interaction between MCSNs and macrophage cells or cancer cells, and the surface properties of MCSNs. (A) CLSM images of MCSNs illustrating the colocalization of the coated membrane and hard SNs (i), the coated membrane, and soft SNs (ii). Blue: Hoechst-labeled nucleus of RAW 264.7 cells; Red: DiI-labeled SNs; Green: CFSE-labeled cell membrane. (Scale bar, 10 µm.) (B) Cell uptake of DiI-encapsulated bare SNs, PEGylated SNs, and MCSNs by macrophage-like cells RAW 267.3. Nanoparticle dose: 1.25 × 10⁹ capsules/mL. Cell uptake was quantitatively analyzed by flow cytometry (n = 3; mean ± SD). (C) Cell viability of Huh-7 cells under various treatments (n = 8; mean ± SD). (D) Cell uptake of DiI-encapsulated PEGylated SNs and MCSNs by HCC cancer cells Huh-7. Nanoparticle dose: 1.25 × 10⁹ capsules/mL. Cell uptake was quantitatively analyzed by flow cytometry (n = 3; mean ± SD). (E) The SDF-1α concentration in the Huh-7 cell culture medium at different incubation times. (F) Flow cytometry analysis of the presence of CXCR4 on the surface of MSCs expressed by mean fluorescence intensity. (G) Flow cytometry analysis of the presence of CXCR4 on the surface of soft and hard NPs expressed by mean fluorescence intensity. (H) Flow cytometry analysis of the presence of integrin α5β1 on the surface of Huh-7 cells expressed by overlay distribution. Cell incubated with only secondary antibody was the control groups. (I) Flow cytometry analysis of the presence of CD90 on the surface of MSCs expressed by overlay distribution. Cell incubated with isotype FITC Mouse IgG1 was the control group. (J) Flow cytometry analysis of the presence of CD90 on the surface of soft and hard NPs expressed by mean fluorescence intensity.

