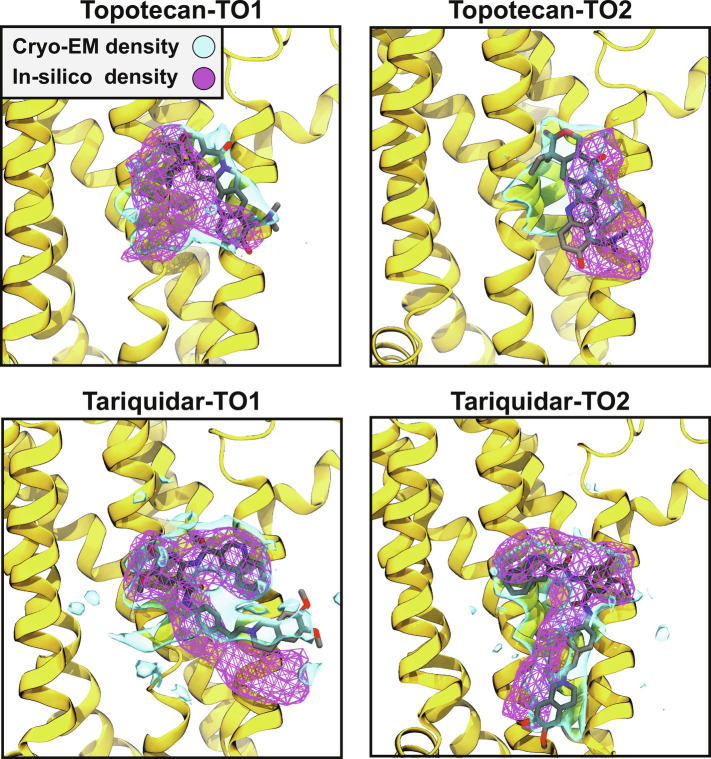
Fig. 3.
Comparison of in silico and cryo-EM obtained densities of the ligands. Cryo-EM and MD obtained densities (accumulated for both replicas of each system during 2 μs of production runs) of the ligands are shown for both topotecan and tariquidar in TO1 and TO2 conformations, demonstrating a good degree of overlap. The cryo-EM densities are shown at isovalue 0.2, whereas the in-silico densities are represented at an isovalue of 0.5. Only one of the monomers is shown to render a more visible binding pocket. The snapshots are viewed from the side. The cryo-EM and in silico densities are represented in solid blue surfaces and magenta meshes, respectively. The cryo-EM modeled ligand in each case is also represented.

