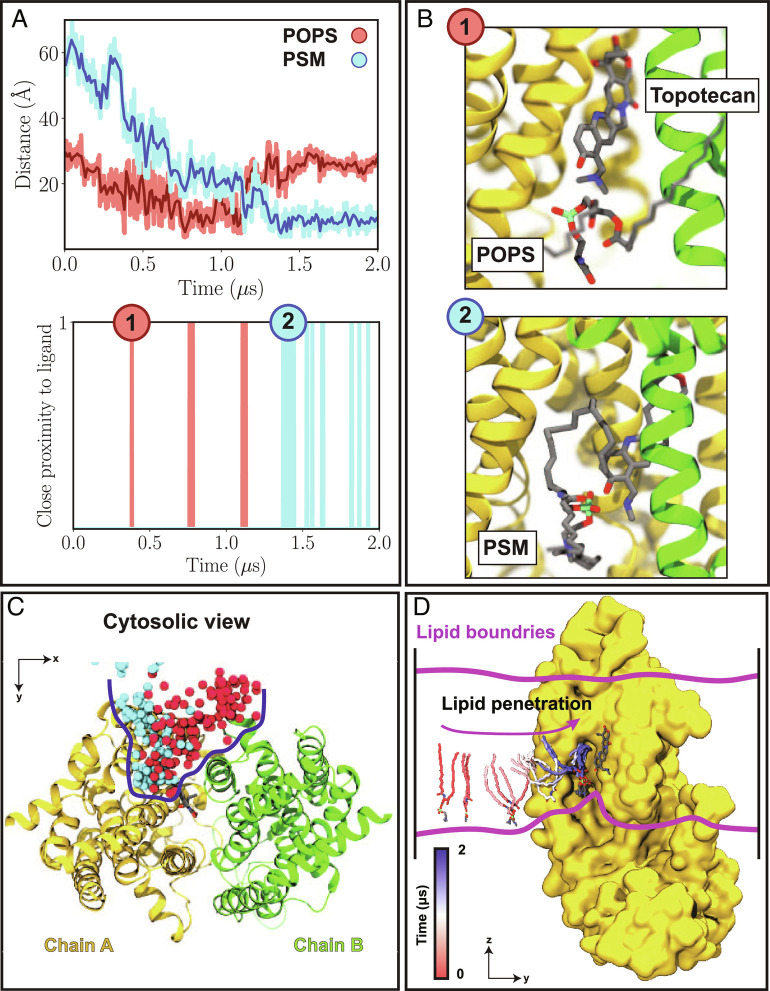
Fig. 4.
Direct lipid–ligand interaction in ABCG2. (A) Top, Distance time series between the phosphorus atom of lipids that penetrate the binding pocket and the titratable nitrogen atom of the bound topotecan. The distances for the first (POPS) and second (PSM) visiting lipids are shown in red and cyan, respectively. Bottom, Instances of lipid–topotecan proximity (P-N distances < 5.0 Å) during the simulations. (B) Two representative snapshots (1 to 2, corresponding to time stamps in (A)) highlighting close lipid–topotecan interactions (1: POPS; 2: PSM). The two pseudosymmetrically related halves of ABCG2 (chains A and B) are shown in yellow and green, respectively. (C) Cytosolic view of lipid penetration into the binding pocket of ABCG2 observed during the 2 μs trajectory, with the phosphorus atoms of the first and second visiting lipids in red and cyan, respectively. Lipid penetration range into the protein is highlighted with a blue line, and the ligand is drawn in licorice to highlight its proximity to lipids. (D) Snapshots describing the trajectory of the PSM lipid that penetrated into the binding pocket shown from the side. Lipid tails are colored according to the time in the trajectory, with red and blue representing the beginning and end of the simulation, respectively. Chain B is removed for a better view of the luminal binding pocket.

