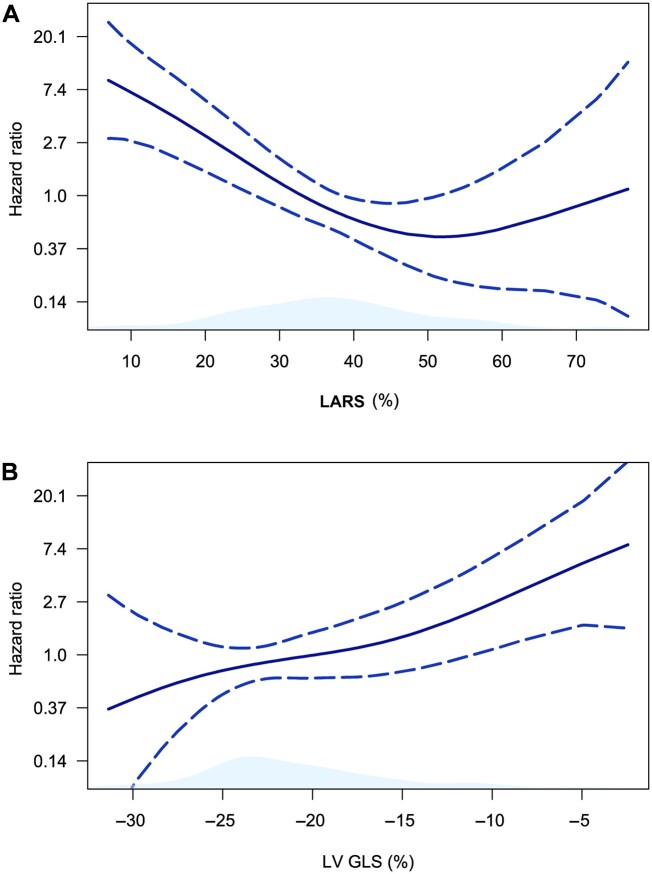
Fig. 2.
Spline curves demonstrating the hazard ratio for all-cause mortality according to LARS and LV GLS
The curves in (A) and (B) demonstrate the hazard ratio change for all-cause mortality with 95% CIs (blue dotted lines) in patients with SSc, across a range of values of LARS (A) and LV GLS (B) at the time of CMR. CMR: cardiac magnetic resonance; LARS: left atrial reservoir strain; LV GLS: left ventricular global longitudinal strain.

