Figure 1.
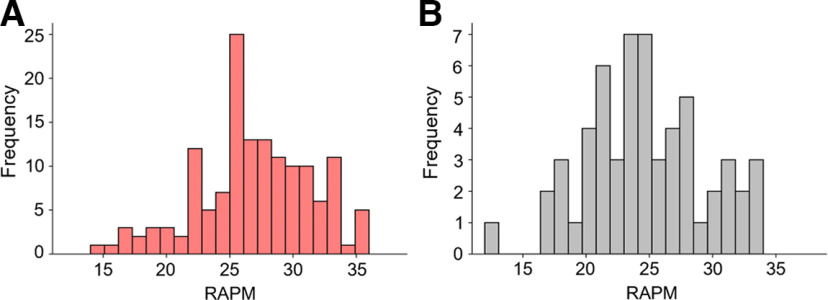
Frequency distributions of intelligence scores. Frequencies of individual intelligence scores (RAPM sum scores, Raven and Court, 1998) are depicted for (A) the main sample and (B) the replication sample.Figure Contributions: Jonas A. Thiele and Kirsten Hilger designed research. Jonas A. Thiele, Aylin Richter, and Kirsten Hilger performed research. Jonas A. Thiele and Aylin Richter analyzed data.

