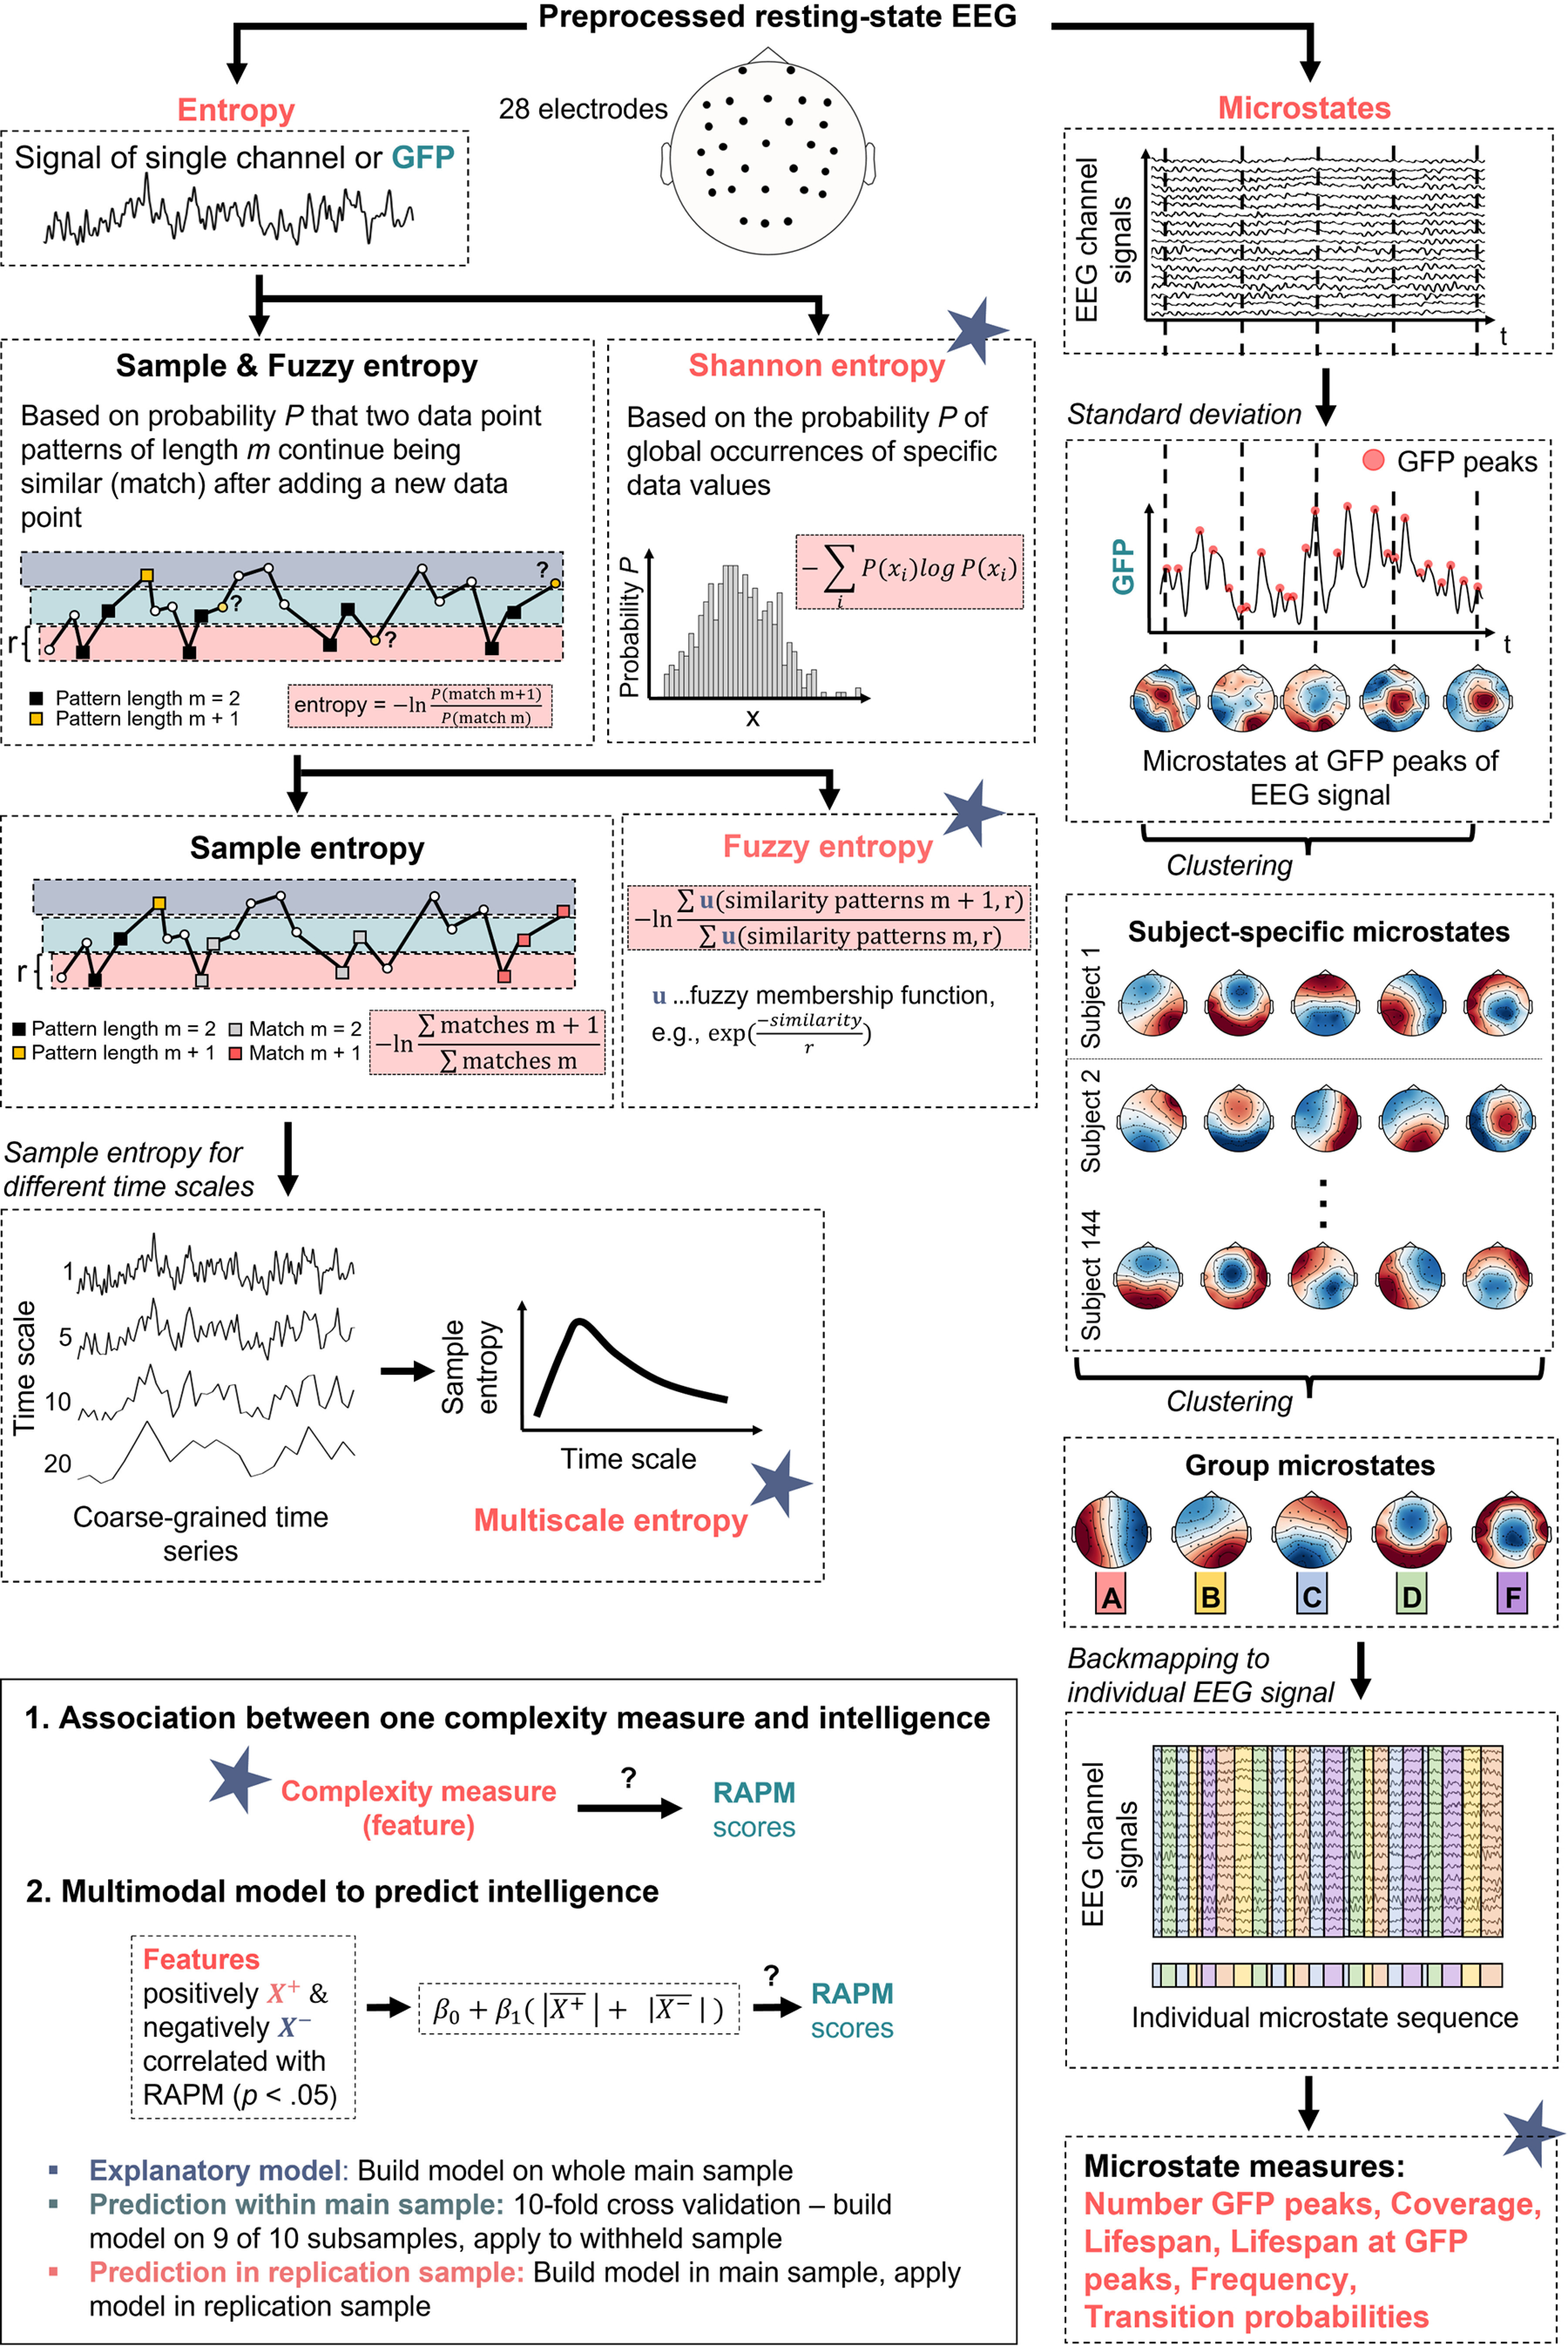
Figure 2.

Schematic overview of the analyses to investigate relations between brain signal complexity and intelligence (RAPM sum scores; Raven and Court, 1998). First, from the preprocessed resting-state electroencephalography (EEG) signals of 144 participants different entropy measurers (Shannon entropy, Fuzzy entropy, multiscale entropy, see left branch) and microstate measures (number of GFP peaks, coverage, lifespan, lifespan at GFP peaks, frequency, and transition probabilities between microstates, see right branch) were computed. Entropy measures were determined for the GFP of the EEG signal and for each EEG channel, respectively; for multiscale entropy, sample entropy was calculated for different coarse-grained time series (scales). For microstate analyses, individual brain signals at GFP peaks were clustered (k-means) over time into five individual spatial mean maps (microstates). The individual mean maps of all participants were then clustered into five group microstates. These group-average microstates were then mapped back onto the individual EEG time series resulting in a sequence of group microstates for each individual from which different microstate measures were derived. As depicted in the lower left box, first, all associations between intelligence and single complexity measures were determined. Second, a multimodal model was constructed from measures of brain signal complexity significantly positively or negatively correlated (p < 0.05, uncorrected) with intelligence. It was tested (1) to which extent the model explains intelligence scores in the main sample, (2) with which accuracy the model predicts intelligence scores within the main sample (10-fold cross-validation), and (3) with which accuracy the model predicts intelligence scores in the replication sample (out-of-sample prediction, model build in the main and applied to the replication sample). GFP, Global field power. Note that all equations are simplified for illustration purposes, see Materials and Methods for more details.Figure Contributions: Jonas A. Thiele and Kirsten Hilger designed research. Jonas A. Thiele created the figure.
