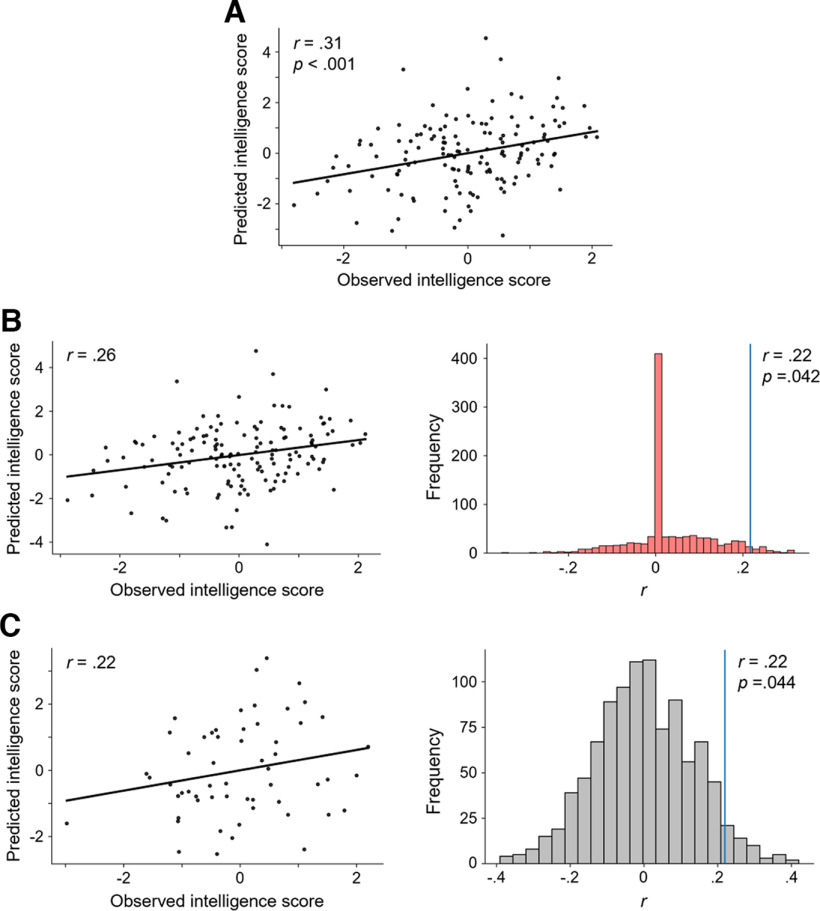
Figure 8.
Multimodal brain signal complexity predicts individual intelligence (RAPM; Raven and Court, 1998) scores. Model performances were assessed via Pearson correlation r between the observed and predicted intelligence scores. Standardized residuals (controlled for age, sex, and number of removed epochs) of intelligence scores and complexity measures were used. A, Explanation: Model to explain variation in individual intelligence scores in the main sample (N = 144) from measures of brain signal complexity positively or negatively correlated (p < 0.05, uncorrected) with intelligence. B, In-sample prediction. Left, Observed versus predicted intelligence scores based on 10-fold internal cross-validation within the main sample. Predicted intelligence scores result from a model based on measures of brain signal complexity positively and negatively correlated (p < 0.05, uncorrected) with intelligence. Results of the model with the highest accuracy (from 100 different stratified sample divisions). Right, Result of a permutation test for testing significance of the prediction. The correlation of the prediction model (blue vertical line) was computed as average of correlations between predicted and observed intelligence scores from 100 models (with different stratified sample divisions) using internal 10-fold cross-validation. This average correlation was then tested against performances of models constructed on the basis of permutated intelligence scores (1000 times, null models, histogram). Note that the high frequency of zero correlations occurred as a correlation of zero was automatically set if no measure of brain signal complexity correlated significantly with the permutated RAPM scores (p < 0.05, uncorrected). C, Out-of-sample prediction. Left, Observed versus predicted intelligence scores in the replication sample (N = 57). Predicted intelligence scores for the replication sample resulting from a model that was constructed on the main sample, i.e., model in A. Right, Permutation test for testing the significance of this prediction. The true model performance (blue vertical line) was tested against predictions of the same model for 1000 permutated intelligence scores within the replication sample.Figure Contributions: Jonas A. Thiele and Kirsten Hilger designed research. Jonas A. Thiele, Aylin Richter, and Kirsten Hilger performed research. Jonas A. Thiele and Aylin Richter analyzed data.

