
Fig. 3.
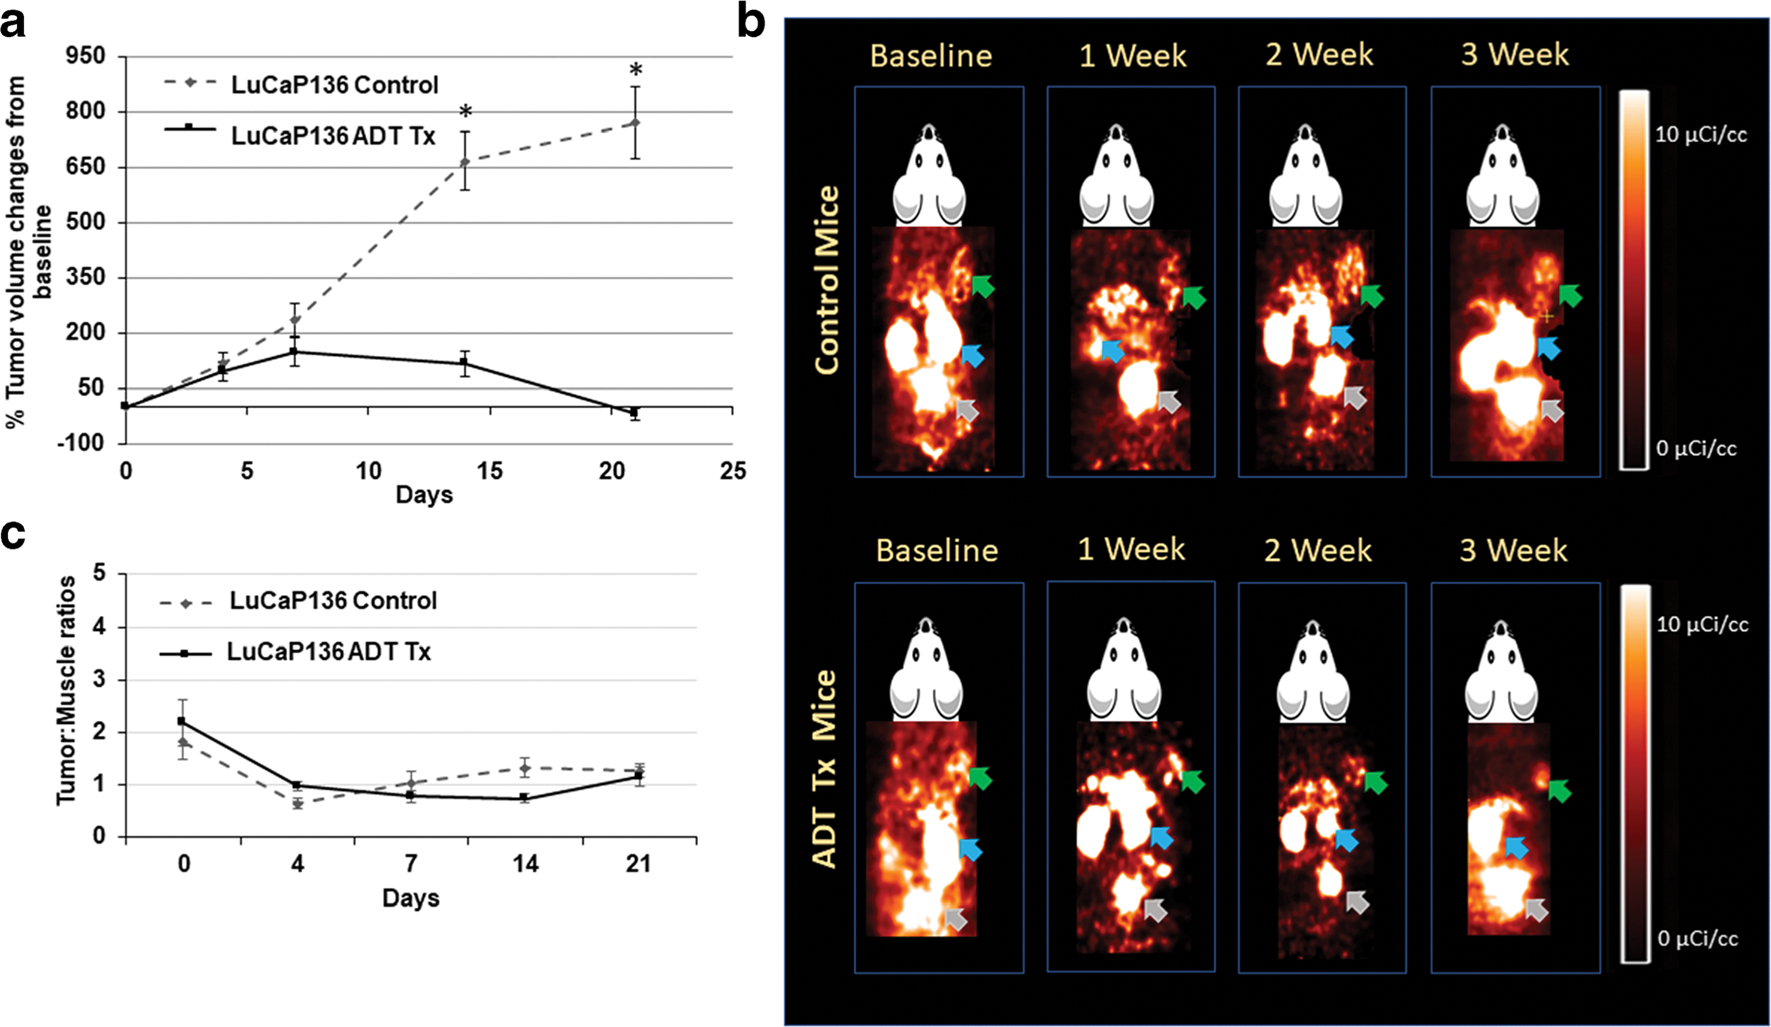
a Comparison of % changes in tumor volumes from baseline in control and ADT-treated LuCaP136 tumor-bearing mice at baseline (0), 2, 7, 14, and 21 days (mean ± SE, n = 5–7 mice; *significant difference between groups, P < 0.05). b Representative [18F]DCFPyL PET images (60 min post-injection) in LuCaP136 control and ADT-treated tumor-bearing mouse over the course of therapy. Green, blue, and grey arrows indicate tumor, kidneys, and bladder respectively. c LuCaP136 tumor:muscle ratios calculated from PET image analysis in control and treated groups (mean tumor:muscle ratios ± SE, n = 5–7 mice; *significant difference between groups, P < 0.05).