Fig. 4.
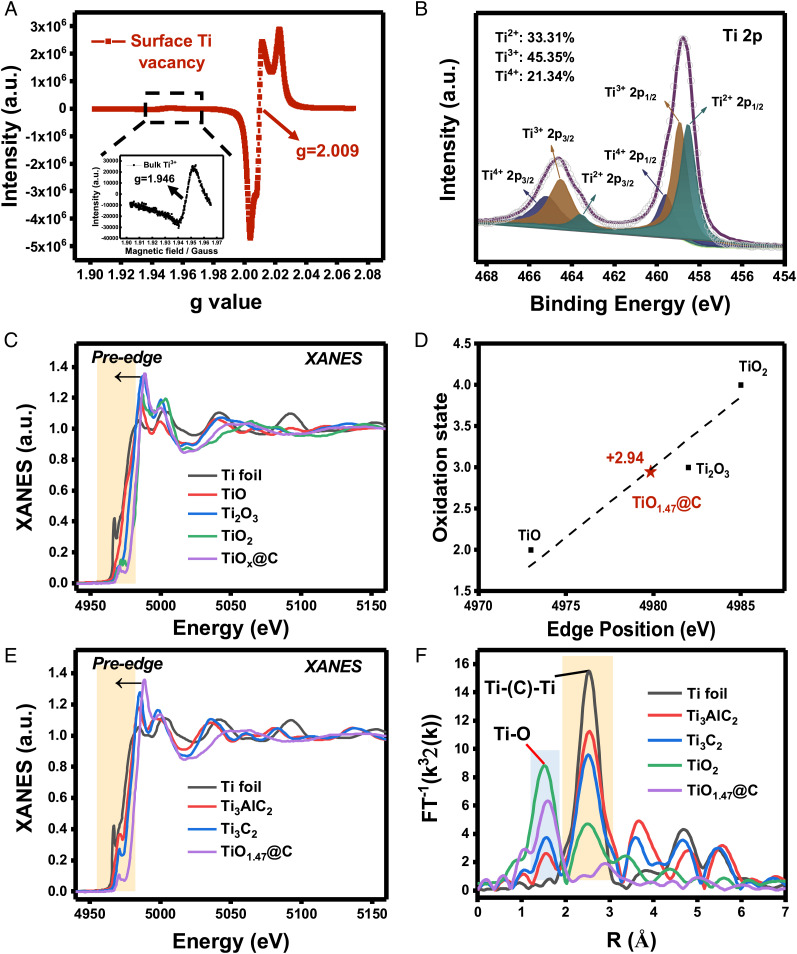
Chemical state and atomic local structure of TiOx@C catalyst. (A) EPR spectra (77K) of TiOx@C showing a clear surface Ti vacancy signal (g = 2.009) and a significantly weaker bulk Ti3+ signal (g = 1.946, Inset). (B) High-resolution XPS spectrum of Ti 2p. The percentage of valences of Ti element was calculated as Ti2+: 33.31%, Ti3+: 45.35%, and Ti4+: 21.34%. (C) Normalized Ti K-edge XANES spectra of Ti foil, TiO, Ti2O3, TiO2, and TiOx@C. (D) Estimation of the titanium oxidation state in TiOx@C. According to the XANES spectra of Ti from the edge position of references to TiO, Ti2O3, and TiO2, Ti was calculated to be in an average of 2.94+ oxidation state in TiOx@C, with x = 1.47. (E) Normalized Ti K-edge XANES spectra of Ti foil, Ti3AlC2, Ti3C2, and TiO1.47@C, respectively. (F) The k3-weighted FT spectra from Ti K-edge EXAFS.

