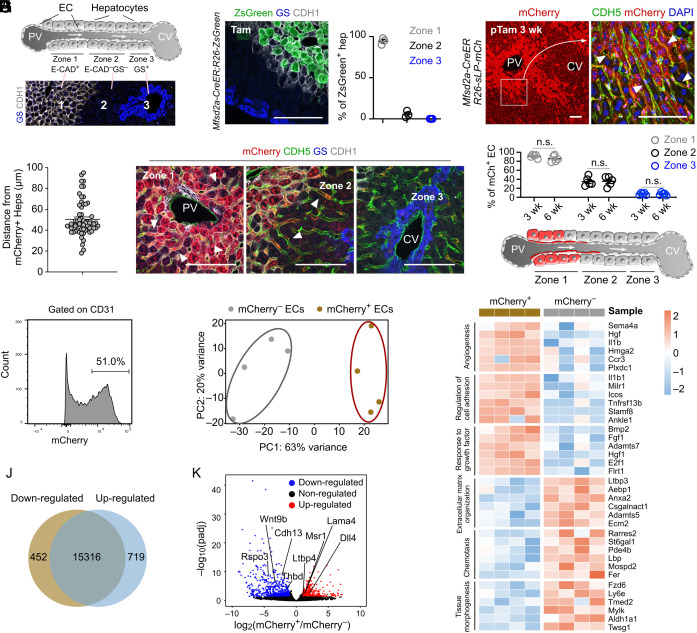
Fig. 2.
Identification and characterization of neighboring ECs of Mfsd2a+ hepatocytes. (A) Cartoon showing 3 liver zones from the PV (portal vein) to the CV (central vein). The Lower panel shows liver sections immunostaining with E-cadherin (CDH1) and glutamine synthetase (GS). (B) Immunostaining for CDH1 and GS on liver sections from Mfsd2a-CreER;R26-ZsGreen at 2d after tamoxifen treatment. The Right panel shows the quantification of the percentage of ZsGreen+ hepatocytes from each zone. n = 3. (C) Immunostaining on liver sections from Mfsd2a-CreER;R26-sLP-mCh at 3 wk after tamoxifen treatment. Arrowheads, mCherry+CDH5+ ECs. (D) Quantification of labeling distance of sLP-mCherry for endothelial cells in livers from (C). n = 60 ECs. (E) Immunostaining on liver sections from Mfsd2a-CreER;R26-sLP-mCh at 3 wk after tamoxifen treatment. Arrowheads, mCherry+CDH5+ ECs. (F) Quantification of the mCherry+ ECs for each zone at 3 or 6 wk after tamoxifen treatment. n = 5. (G) Cartoon showing the ECs labeled by sLP-mCherry in Mfsd2a-CreER;R26-sLP-mCh mice. (H) FACS analysis of the percentage of mCherry+ ECs. (I) Principal component analysis of endothelial cell signatures. n = 4. (J) Venn diagram of differentially expressed genes between mCherry+ and mCherry– ECs. (K) Volcano plot of differentially expressed genes between mCherry+ and mCherry– ECs. (L) Heatmaps of top differentially expressed genes according to Gene Ontology classes. Data are represented as mean ± SEM. n.s., not significant (P > 0.05). (Scale bars, 100 μm.)

