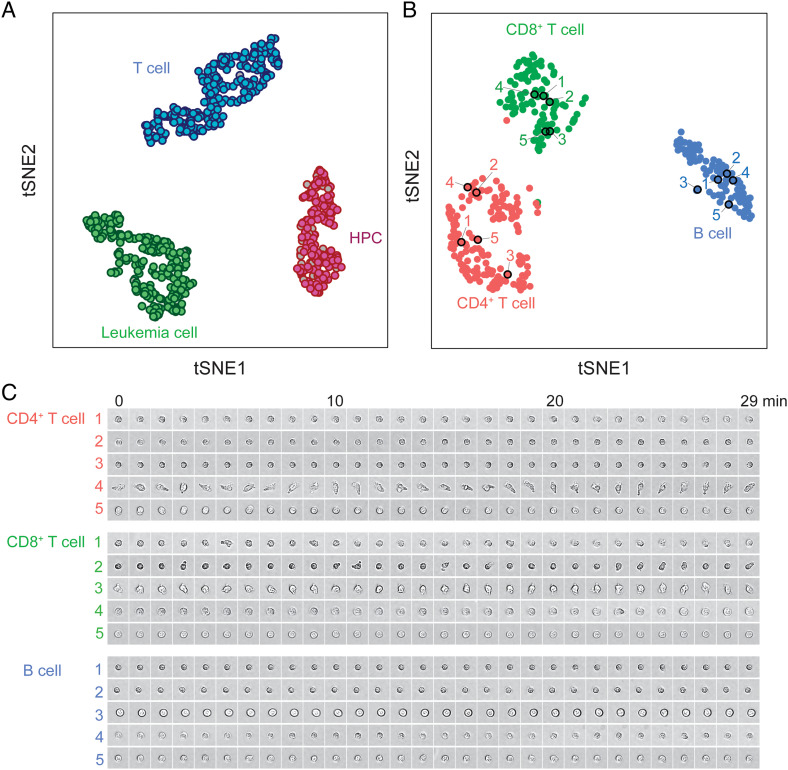
Fig. 2.
ALPS-linked cell images and whole transcriptome for the same cell. (A) t-SNE visualization of single cells from 3mix-ALPS-random&target-multimode clustered based on whole transcriptomes. Filled colors represent the cell types determined by fluorescent images; the gray color indicates that the cell type was undetermined due to low fluorescent intensities. The edge colors represent the cell types determined by the transcriptome. (B) t-SNE visualization of all PBMCs clustered based on whole transcriptomes. The colors represent the cell types determined by the transcriptome. The black circles and numbers correspond to the cells shown in (C). (C) Examples of bright-field time-lapse cell images of PBMCs (SI Appendix, Text 10). Image size, 20 μm × 20 μm. The contrast of the images shown in (C) changed linearly.

