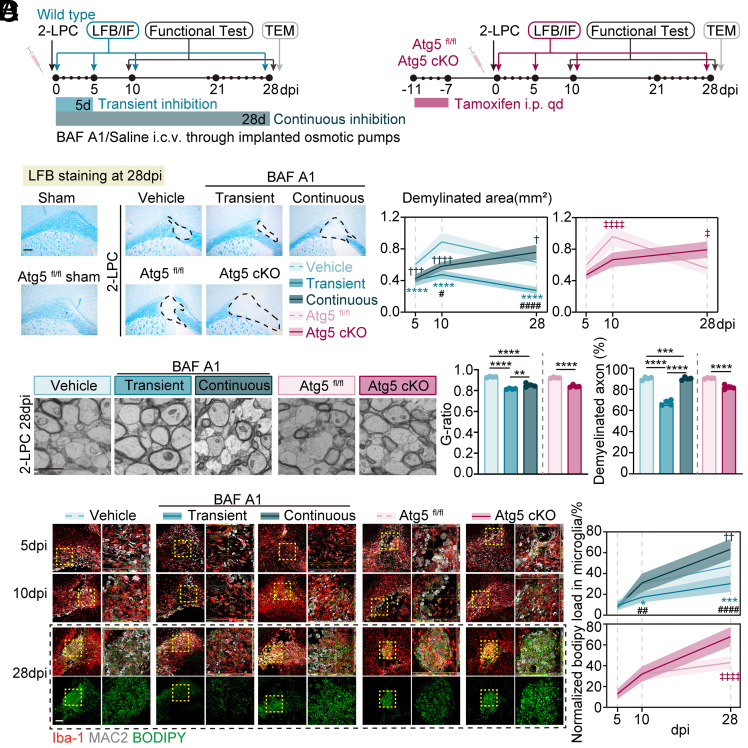
Fig. 2.
Staged inhibition of autophagy activation led to less lipid droplet accumulation and smaller demyelinated lesions. (A) Schematic representing the experimental strategy in microglia-specific Atg5 deficient mice and wild-type mice receiving BAF A1. For transient and continuous inhibition of autophagy, micro-osmotic pumps were applied for the intracerebroventricular administration of BAF A1 (4 nmol/kg/d) for 5 d and 28 d, respectively. (B) Representative images of LFB staining and quantification of demyelinated area. n = 6 mice per group. (Scale bar, 200 μm.) Data are expressed as mean ± SD, two-way ANOVA with Bonferroni’s post hoc test; ****P < 0.0001 represented transient inhibition group vs. vehicle group, ††††P < 0.0001 represented continuous inhibition group vs. vehicle group; #P < 0.05 and ####P < 0.0001 represented continuous inhibition group vs. transient inhibition group. ‡P < 0.05 and ‡‡‡‡P < 0.0001 for Atg5 fl/fl vs. Atg5 cKO group. (C) Electron microscope images of corpus callosum at 28 dpi and quantification of g-ratios, demyelinated axon numbers. n = 4 mice per group. Data are expressed as mean ± SD, one-way ANOVA with Bonferroni’s post hoc test; **P < 0.01, ***P < 0.001, ****P < 0.0001. (Scale bar, 1 μm.) (D) Representative images of corpus callosum stained for Iba-1+ microglia, BODIPY+ LD, Mac2+ phagocytosis, quantification of BODIPY+ lipid droplet area normalized to lesion area. n = 6 mice per group. Data are expressed as mean ± SD, two-way ANOVA with Bonferroni’s post hoc test; *P < 0.05, and ****P < 0.0001 represented vehicle vs. BAF A1 group; ###P < 0.001 and ####P < 0.0001 represented Atg5 fl/fl vs. Atg5 cKO group. (Scale bar, 100 μm (Left) and 20 μm (Right).)

