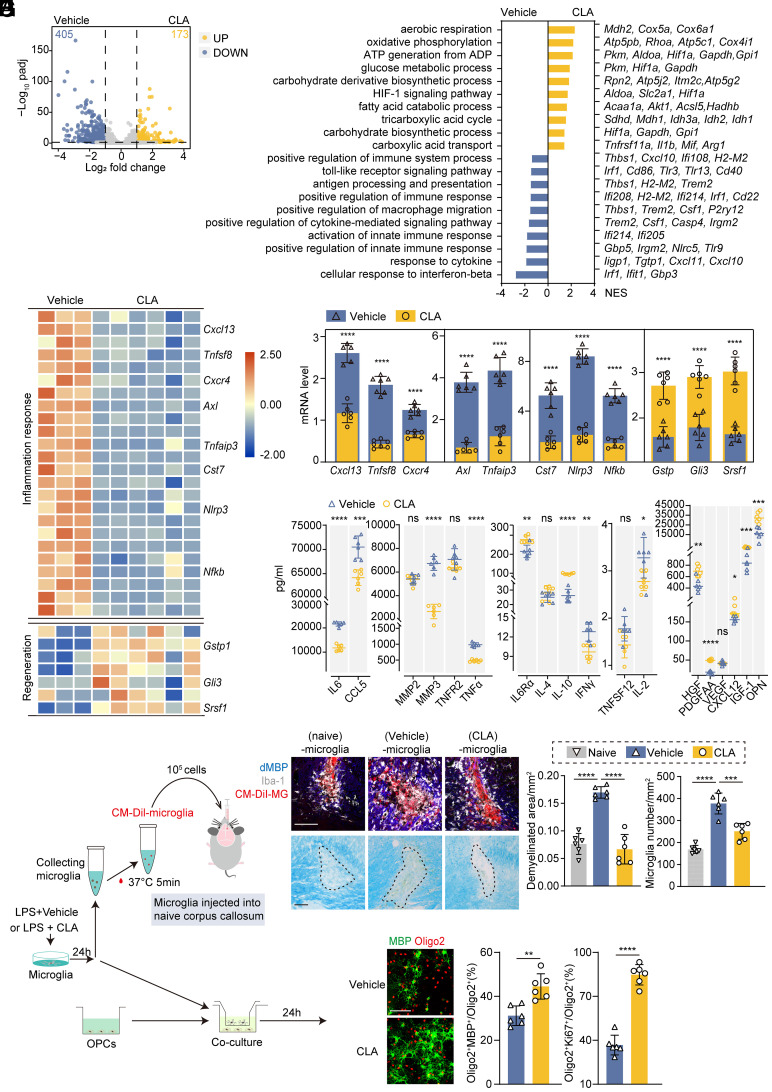
Fig. 5.
CLA administration ameliorated LPS-stimulated microglial inflammation and facilitated OPCs regeneration. (A) Volcano plot of LPS-stimulated microglia with or without CLA treatment showing 173 down-regulated (blue) and 405 up-regulated (yellow) DEGs (|log2FC| > 1, FDR < 0.05). (B) Top up-regulated and down-regulated pathways with featured genes in LPS-stimulated microglia with (Right) and without (Left) CLA. (C and D) Heatmap showing genes linked to inflammation and pro-regenerative properties under LPS stimulation with or without CLA treatment (C) and individual dot plots of selected genes measured by qPCR (D). n = 6 independent replicates. Data are expressed as mean ± SD, one-way ANOVA with Bonferroni’s post hoc test; ****P < 0.0001 vs. the vehicle group. Numerical data with statistics are shown in SI Appendix, Table S7. (E) Quantification of secretory cytokines and chemokines as measured using Luminex. n = 6 independent replicates. Data are expressed as mean ± SD, one-way ANOVA with Bonferroni’s post hoc test; ns not significant, *P < 0.05, **P < 0.01, ***P < 0.001, ****P < 0.0001 vs. the vehicle group. (F) Schematic depicting LPS-stimulated microglia with or without CLA treatment injected into the naïve corpus callosum and co-cultured with OPCs. (G) Representative images of the corpus callosum stained with dMBP, Iba-1, CM-Dil-microglia, and LFB. Quantification of the demyelinated areas. n = 6 mice per group. One-way ANOVA with Bonferroni’s post hoc test; ***P < 0.001, ****P < 0.0001. (Scale bar, 100 μm.) (H) Representative images of MBP (mature oligodendrocytes) and Olig2 (oligodendrocytes). MBP+ Olig2+ and Ki67+ Olig2+ cells were quantified as percentages of the total Oligo2+ cells. n = 6 independent replicates. Data are expressed as the mean ± SD, one-way ANOVA with Bonferroni’s post hoc test; **P < 0.01, ****P < 0.0001. (Scale bar, 100 μm.)

