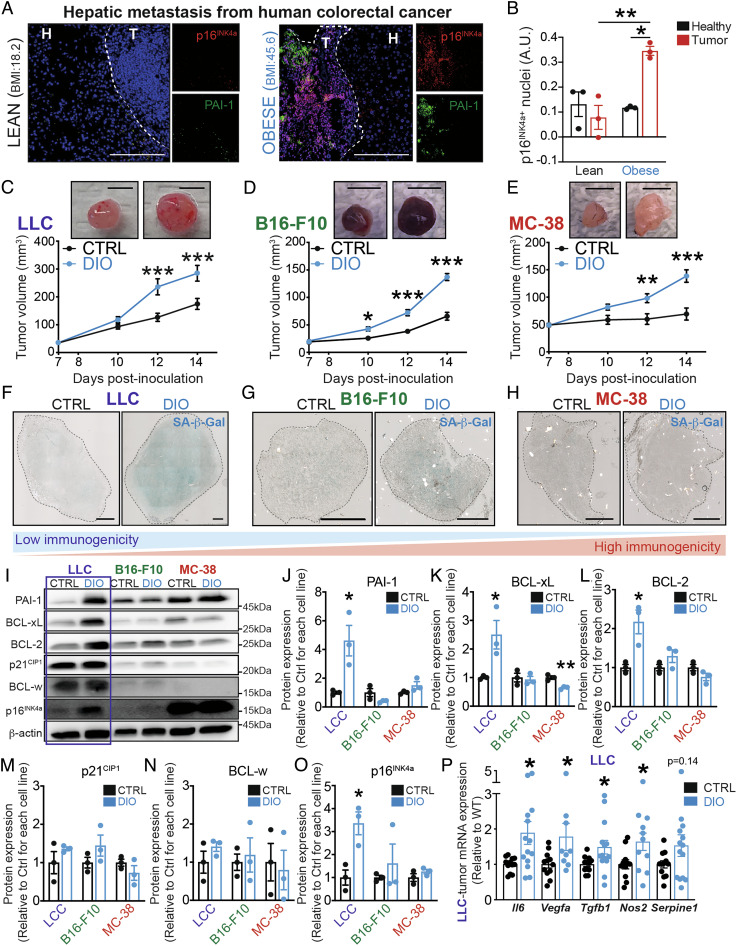
Fig. 1.
Diet-induced obesity potentiates tumor growth and triggers tumoral senescence in poorly immunogenic tumors. (A) Representative immunofluorescence images showing p16INK4a (in red), PAI-1 (in green), and merged images with DAPI (in blue) in lean and obese patients. Dashed lines delimit between healthy (H) and tumoral (T) tissues (scale bar, 200 μm). (B) Bar charts represent colocalization analysis between p16INK4a and DAPI within healthy and tumoral regions using Pearson’s correlation. (C–E) Volumetric analysis of tumor growth, using caliper, of mice under DIO and CTRL-fed mice in a time course after (C) LLC, (D) B16-F10, or (E) MC-38 inoculation at 7, 10, 12, and 14 d (scale bar, 5 mm). (F–H) Representative images of senescence-associated β-galactosidase activity (SA-β-Gal) on (F) LLC, (G) B16-F10, or (H) MC-38 tumor cross sections (scale bar, 1,000 μm). (I) Representative WB images of markers of cellular senescence in whole LLC, B16-F10, and MC-38 tumors of mice under DIO or CTRL-fed diet. (J–O) Bar charts represent quantification of protein levels of (J) PAI-1, (K) BCL-xL, (L) BCL-2, (M) p21CIP1, (N) BCL-w, and (O) p16INK4a in tumor lysates. Data are normalized to their respective cancer cell line CTRL and shown as folds. (P) Bar charts represent analysis of SASP-related factors using mRNA expression of Il6, Vegfa, Tgfb1, Nos2, and Serpine1 in whole LLC-tumor lysates. Human data represent three independent samples. WB data represent n ≥ 3 from independent experiments. Statistics: (B) One-way ANOVA and Bonferroni post hoc test (C–E) Two-way ANOVA and Bonferroni post hoc test. (J–P) Two-tailed unpaired Student’s t test. * P < 0.05, **P < 0.01, ***P < 0.001; 95% CI. Error bars represent mean ± SEM. Each n represents biological replicates.

