Fig. 2.
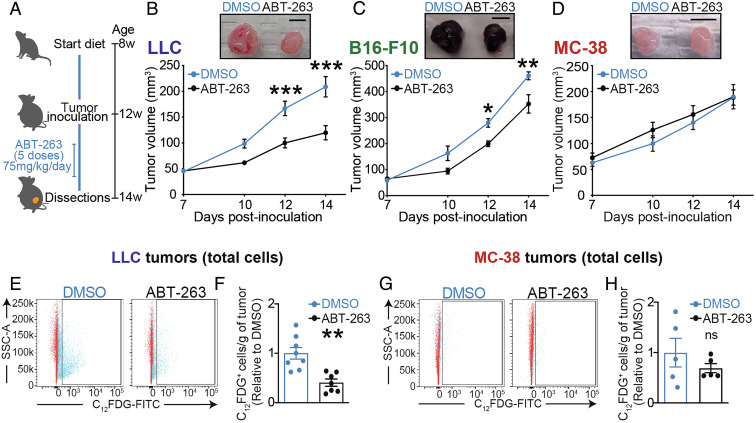
Therapeutic senolysis hinders obesity-driven tumor growth in poorly immunogenic tumors. (A) Schematic representation of the experimental paradigm combining diet-induced obesity with ABT-263 treatment. (B–D) Curve represents tumor growth in vivo using caliper volumetric measurements of (B) LLC, (C) B16-F10, or (D) MC-38 cells. (E–H) Representative FACS histograms and quantification of C12FDG+ cells in (E, F) LLC tumors or (G, H) MC-38 tumors from DMSO- or ABT-treated mice. Bar charts indicate the relative number of C12FDG+ cells per gram of tumor. Tumor monitoring and FACS data represent ≥2 independent experiments with n ≥ 5 biological replicates. Statistics: (B–D) Two-way ANOVA and Bonferroni post hoc test. (F, H) Two-tailed unpaired Student’s t test. * or § P < 0.05, ** or §§ P < 0.01, *** or §§§ P < 0.001; 95% CI. Error bars represent mean ± SEM. Each n represents biological replicates

