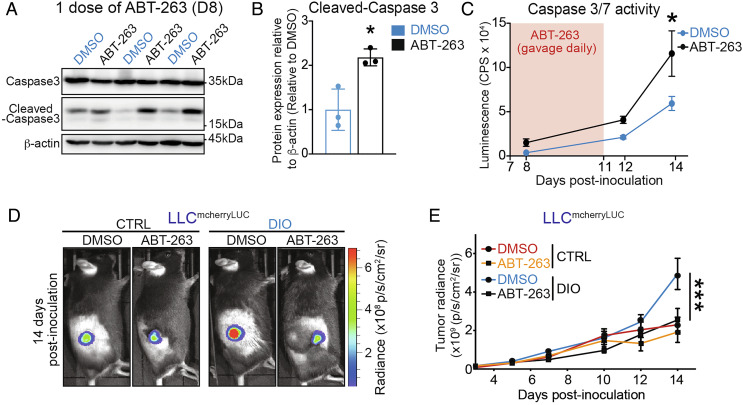
Fig. 3.
ABT-263 triggers tumoral apoptosis and impedes tumor growth in DIO to rates observed in nonobese mice. (A) Representative WB images of caspase 3 and cleaved-caspase 3 in whole LLC tumors from mice in DIO after a single dose of ABT-263 or DMSO. (B) Bar charts represent the quantification of protein levels of caspase 3 and cleaved-caspase3 in tumor lysates. Data are normalized to DMSO and shown as folds. (C) Curve represents caspase 3 and caspase7 activation at 1 (D8 after inoculation), 5 (D12 after inoculation), and 7 (D14 after inoculation) days after the first dose of either ABT-263 or DMSO. Luminescence signal was reported as CPS. (D) Representative images of tumors in vivo from ABT-263-treated and control mice at 14 d postinoculation of LLC cells obtained with IVIS. Images overlay the luminescent signals and are represented as radiance (p/s/cm2/sr). Imaging thresholds were optimized for minimizing interbatch variation (min: 4.00e7; max:6.90e8). (E) Curve represents tumor growth in vivo using luciferase activity by means of IVIS. Apoptosis data represent three biological replicates per time point. Tumor monitoring data represent ≥2 independent experiments with n ≥ 4 biological replicates. Statistics: (B) Two-tailed unpaired Student’s t test. (C, E) Two-way ANOVA and Bonferroni post hoc test. *P < 0.05, **P < 0.01, ***P < 0.001; 95% CI. Outliers were determined with the ROUT method (Q = 1, 0%). Error bars represent mean ± SEM. Each n represents biological replicates.

