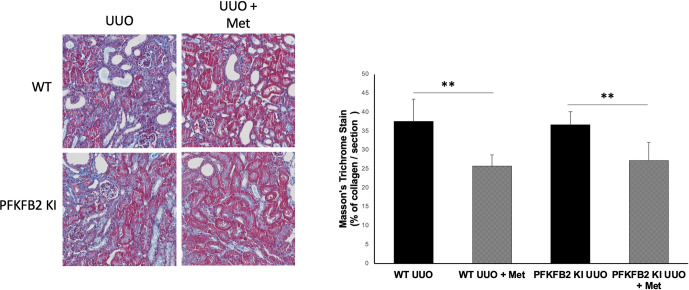
Fig 3.
Masson’s trichrome staining of collagen deposition as a marker of fibrosis for WT and PFKFB2 KI UUO kidneys ± metformin showing representative sections (A) with corresponding quantification (B). Mice treated with metformin had less evidence of collagen deposition per section compared to their untreated counterparts for both WT (**p = 0.0025) and PFKFB2 KI mice (**p = 0.0094). There was no significant difference between WT and PFKFB2 groups. Quantification was performed from a set of images that provided coverage of the whole kidney cortex. Mean + SD.

