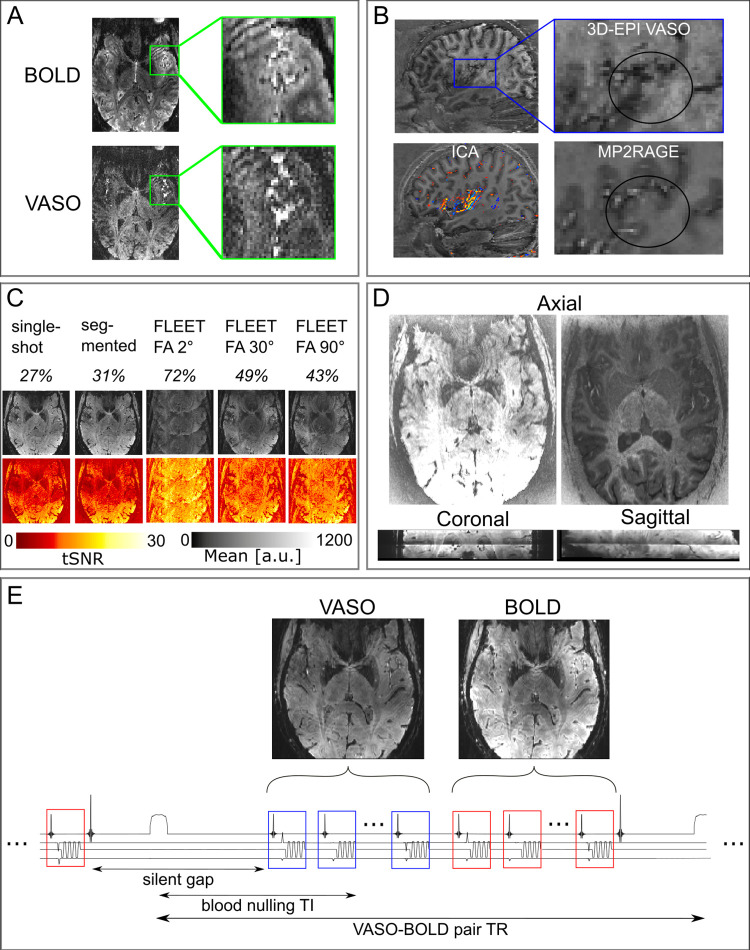
Fig 1. Overview of the challenges encountered when acquiring VASO data in the auditory cortex.
(A) Inflow effects were found in both GE-BOLD and VASO in temporal regions. However, the VASO signal seemed to be more affected by the inflow of not-nulled blood. (B) Cardiac pulsation effects reduced image contrast due to long 3D-EPI readouts. In the functional images, the contrast in our region of interest seemed to be particularly affected. Additional ICA analysis (left bottom) showed the main components around Heschl’s gyrus. (C) In the presence of physiological noise, there is a tradeoff in the amount of ghosts and the tSNR when evaluating different GRAPPA auto calibration signal (ACS) acquisitions. The first row contains the percentage of background signal compared to signal in the auditory cortex. The second row gives an impression of the ghost level and the third row gives an illustration of the tSNR. These tests were conducted for the protocol with 2D-SMS readouts. (D) 2D-SMS VASO resulted in T1-weighted slice-wise intensity differences that were most visible in the middle of the slab. The two axial slices show the intensity differences between two “consecutive” slices (with the same signal intensity scaling). (E) Schematic depiction of one TR of the final SS-SI-VASO sequence. An inaudible phase-skipped adiabatic pulse is used in the inherent silent gap of this sequence. This is followed by the acquisition of a volume of VASO and a volume of BOLD.

