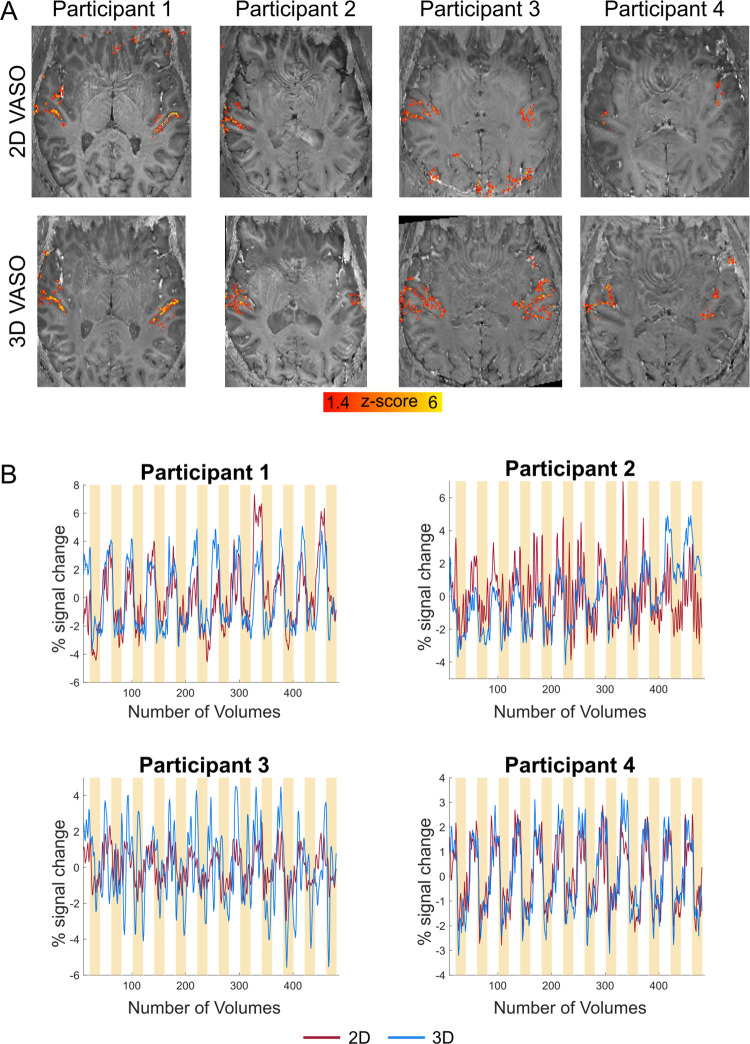
Fig 2. Activation maps and time courses of VASO.
(A) Z-scored activation maps overlayed on distortion corrected mean EPI images (per participant and readout). For our data, using a 3D-EPI readout seems to be beneficial in VASO. (B) VASO time courses (average coming from active voxels) calculated in percent signal change illustrate the negative percent signal change when auditory stimuli are presented. Yellow bars indicate the presentation of auditory stimuli.

