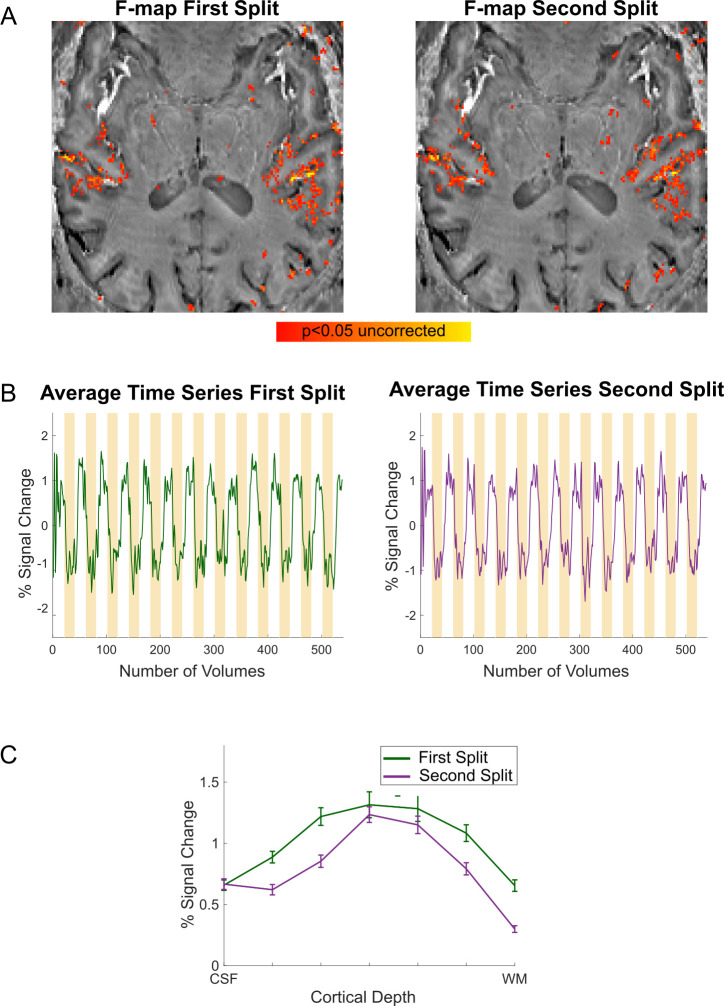
Fig 5. Stability of responses.
(A) F-maps (p<0.05 uncorrected) are displayed on a bias field corrected mean EPI VASO image. (B) Time courses in percent signal change are displayed against our experimental paradigm, illustrating the negative signal change upon auditory stimulation (yellow bars). (C) Laminar responses in a functional activation based ROI for both splits of the data.

