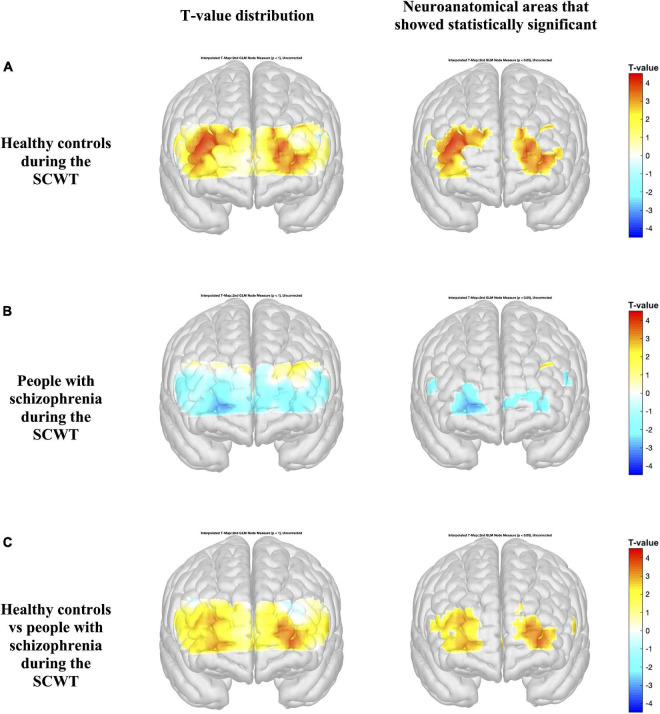
FIGURE 4.
Activation maps based on the general linear model (GLM) compare the HbO2 levels during the rest period and Stroop Color-Word Test (SCWT) (A,B). Differences in HbO2 levels during the SCWT are represented by colormap (C). Figures on the left indicate the T-value distribution and figures on the right highlight the neuroanatomical areas that show statistical significance with p < 0.05 (T-value > 1.96).

