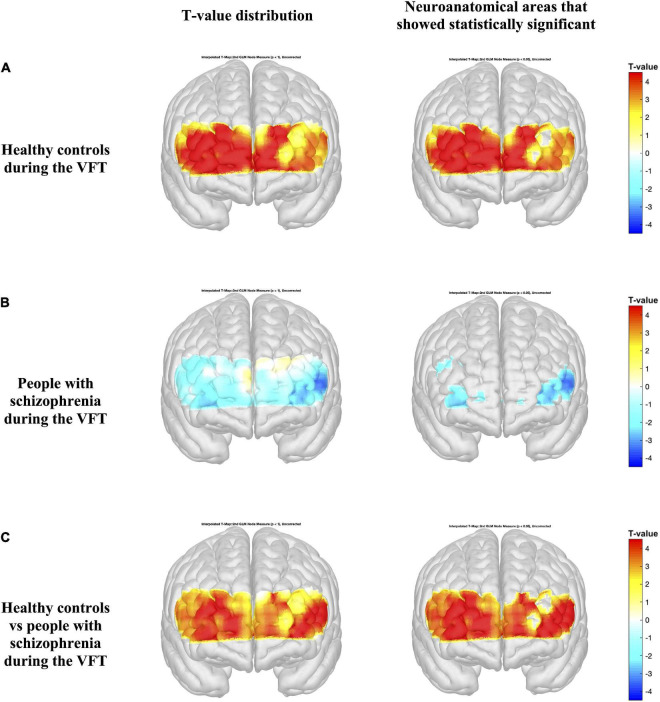
FIGURE 5.
Activation maps from the general linear model (GLM) compare the HbO2 levels during the rest period and verbal fluency test (VFT) period (A,B). Differences in HbO2 levels during the VFT are represented by colormap (C). Figures on the left indicate the T-value distribution and figures on the right highlights the neuroanatomical areas that show statistical significance with p < 0.05 (T-value > 1.96).

