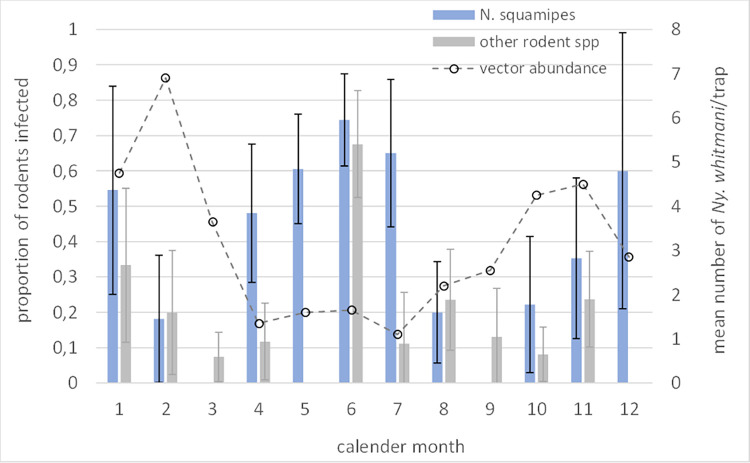
Fig 3. Proportion of rodent populations infection by calendar month.
Prevalence calculated for N. squamipes, and other rodent species by aggregating data. Superimposed is the mean number of Ny. whitmani sand flies per month collected by CDC light trap in this and nearby foci (published data from Brandão-Filho et al 1994 [19]).

