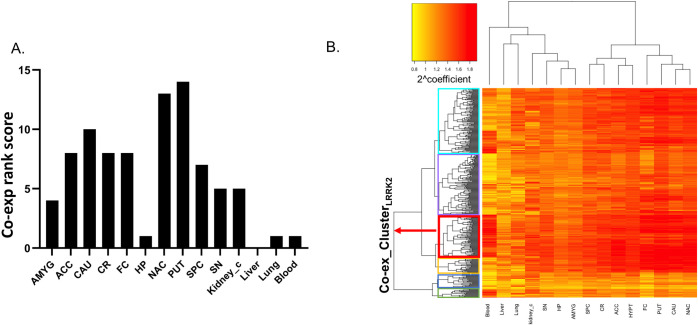
Fig 4. Co-expression analysis on the LRRK2int.
A) Pair-wise Tukey’s test was performed to compare the co-expression coefficients (interactors vs LRRK2) across different tissues. Tissues were ranked according to the results. The bar graph shows that putamen, nucleus accumbens, caudate and hypothalamus are tissues with the highest ranks. Liver presents a rank of 0, meaning the co-expression coefficients of LRRK2 interactors are the lowest in comparison with any other tissues analysed. B) The heatmap was generated from the coefficient matrix (2^coefficient = 2 raised to the power of the coefficient) derived from the co-expression analysis (Heatmap_Co-ex). Darker colour represents higher co-expression coefficient. The horizonal dendrogram of Heatmap_Co-ex was extracted as Den_Co-ex1, which shows the hierarchical clustering of tissues in which the LRRK2 interactors exhibited similar co-expression patterns with LRRK2. The vertical dendrogram of Heatmap_Co-ex was extracted as Den_Co-ex2, which shows the hierarchical clustering of interactors based on the similarity of their co-expression figures with LRRK2 across different tissues. Den_Co-ex2 was cut to generate 6 clusters of LRRK2 interactors (Cluster A-F, marked in green, blue, yellow, red, purple and turquoise, respectively). Interactors in Cluster D presents the highest level of overall co-expression behaviour with LRRK2 across different tissues (referred as Co-ex_ClusterLRRK2). Abbreviations: ACC: Anterior Cingulate Cortex; AMYG: Amygdala; CAU: caudate; CR: cerebellum; FC: frontal cortex; HP: hippocampus; HYPT: hypothalamus; NAc: nucleus accumbens; PUT: putamen; SN: substantia nigra; SPC: spinal cord c-1; Kidney_c: kidney cortex.

