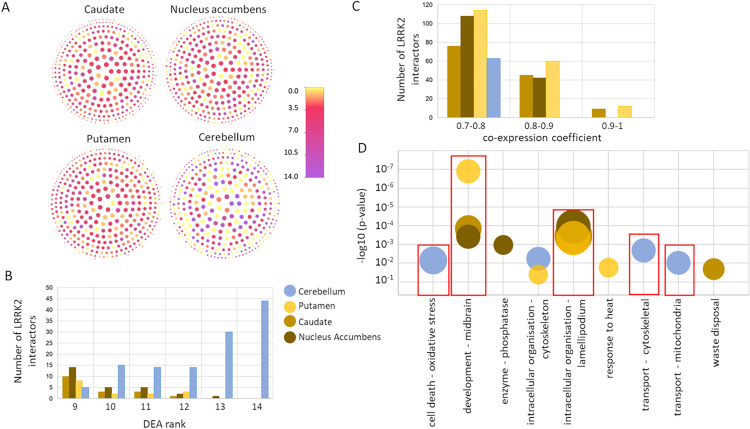
Fig 5. Tissue specific LRRK2ints.
A) The network graphs represent the LRRK2ints with nodes color-coded for DEA ranks and dimension-coded based on the co-expression coefficients. The darker the colour, the higher the expression level of the interactor in a given tissue. The larger the node, the higher the co-expression coefficient calculated between LRRK2 and the interactor in a given tissue. B) For each of the 4 brain regions the LRRK2 interactors with a DEA rank > 8 were extracted and the distribution of the DEA ranks was visualized. C) For each of the 4 brain regions the LRRK2 interactors with a co-expression coefficient ≥ 0.7 were extracted and the distribution of the co-expression coefficients was visualized. D) Functional enrichment results for the tissue-specific LRRK2 interactors; GO:BPs were filtered for term size ≤ 80 to keep only specific terms and GO:BPs were grouped based on semantic similarity. The semantic class is reported on the x-axis, the p-value of the most significant term in the semantic class is reported on the y-axis, the dimension of the circle represent the number of GO:BPs terms grouped in the semantic class. For simplicity, the semantic classes containing only 1 GO:BP term were omitted from the graph. -log10(p-value) = p-value in logarithmic scale, base 10, reverse order.

