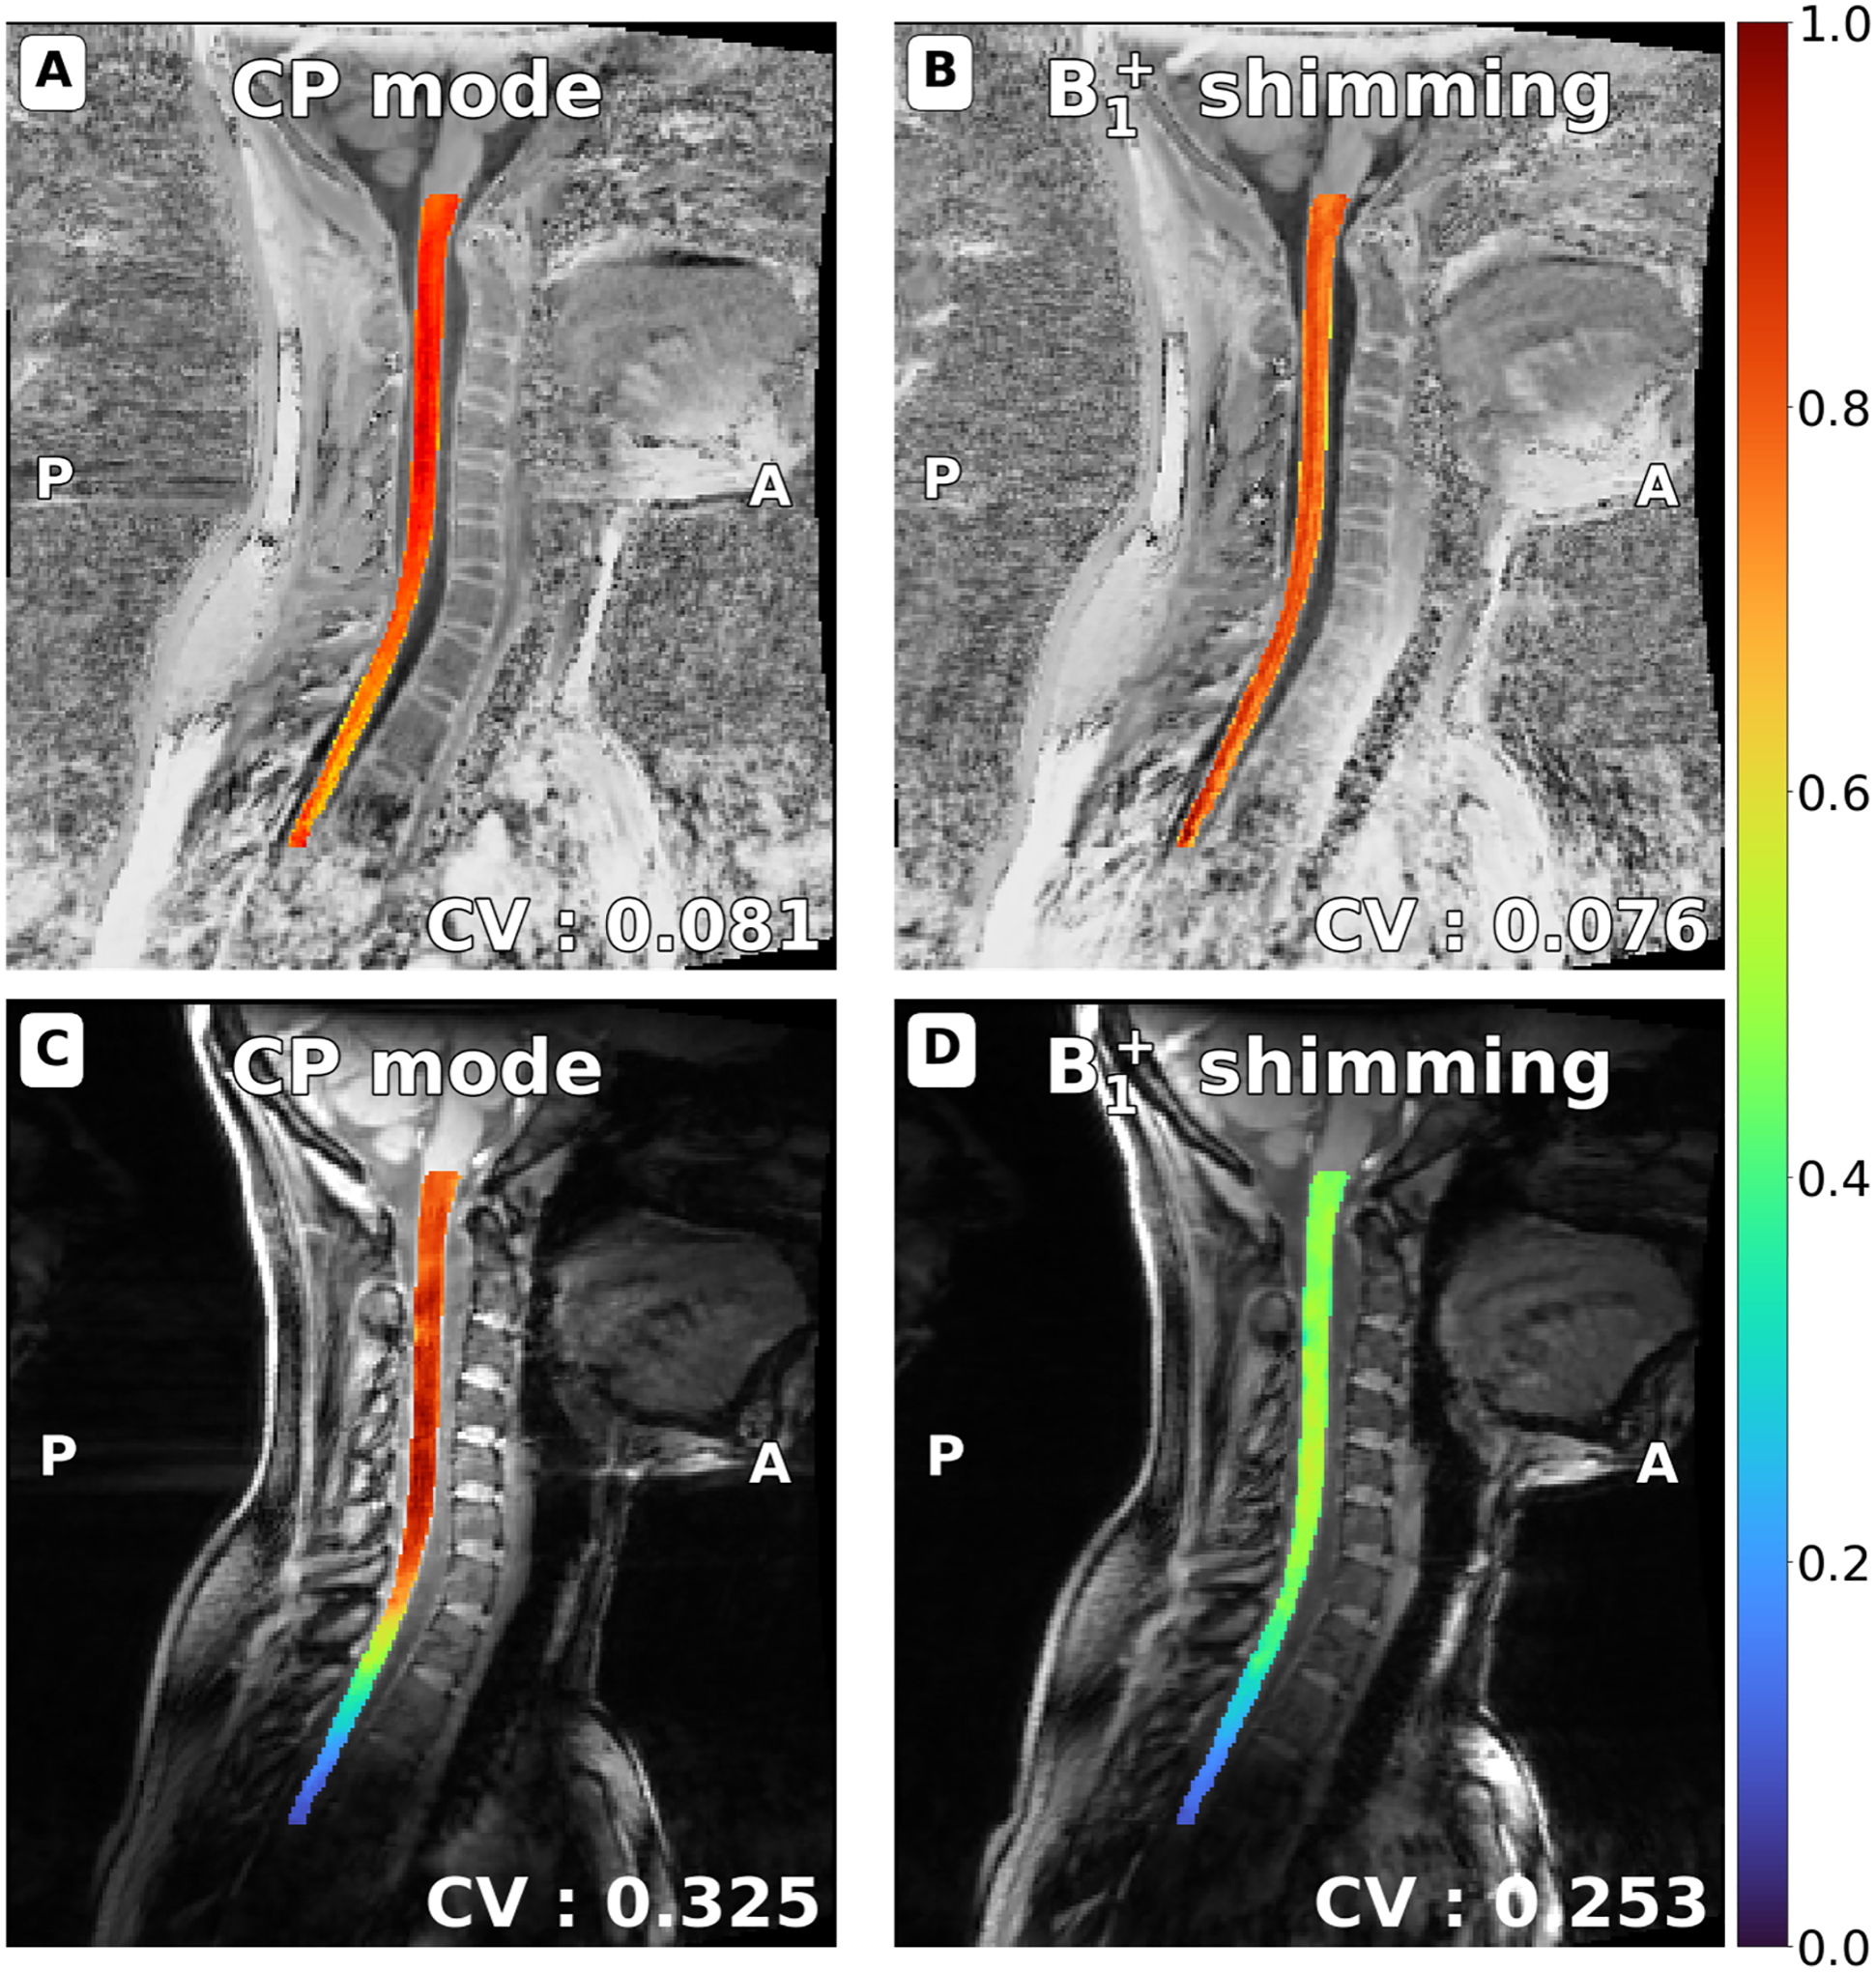
Figure 10:

UNI (A, B) and GRE-INV2 images (C, D) spinal cord images from the MP2RAGE sequence, normalized by the maximum intensity in the spinal cord. Spinal cords were automatically segmented with SCT (and manually adjusted when required) on CP mode and shimmed images and a co-registration was performed. After shimming with Shimming Toolbox, the coefficient of variation in the spinal cord is reduced by 10.59% on UNI images (A, B) and 39.72% on GRE images (C, D).
