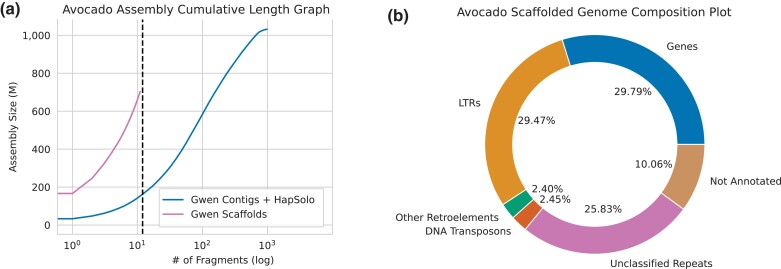
Fig. 1.
a) The cumulative sum assembly graph size (cdf) shows the size of the assemblies with the next largest consecutive contig (or scaffold) being added to the sum along the x-axis for the 2 Gwen assemblies (C + H and scaffolded). b) The annotation results for the Gwen C + H assembly, showing the percentage of the genome attributable to genes and different types of transposable elements, including DNA transposons, unclassified retroelements, and long terminal repeat (LTR) retroelements.

