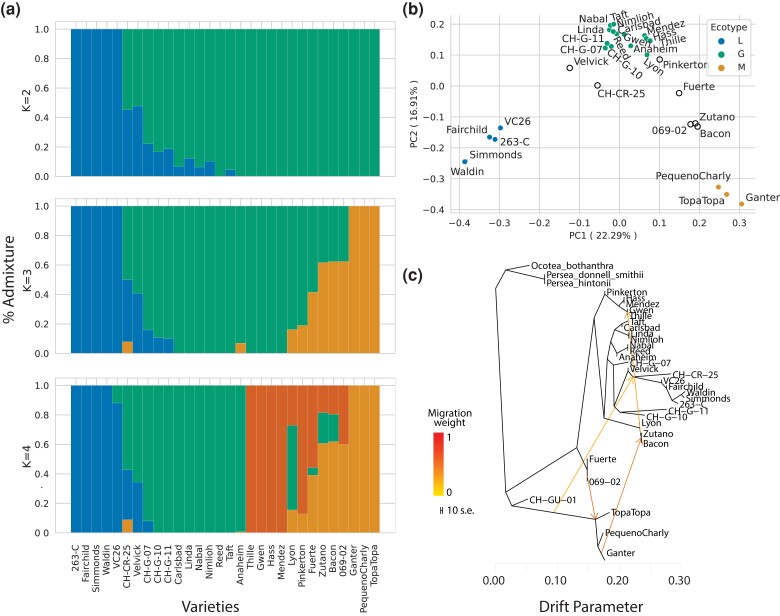
Fig. 2.
a) Admixture plots generated from the entire sample of 30 avocado accessions, using SNPs based on the Gwen scaffolded assembly. The plots show the inferred groups with K = 2, K = 3, and K = 4, which was inferred to be the most likely number of clusters with this data set. The K = 4 groups include the 3 historical groups (Mexican in orange on far right, Guatemalan in green in the center, and Lowland in blue on the left) and another group in red with accessions closely related to Hass. b) A PCA analysis of SNP diversity. Each dot represents an individual, and the color of the dot represents accessions with >80% assignment to a single group, including Guatemalan (G), Mexican (M), and Lowland (L). Open dots represent likely hybrid accessions (c) Results of TreeMix, with the optimal 4 edges. The accessions, including 3 outgroups are labeled.

