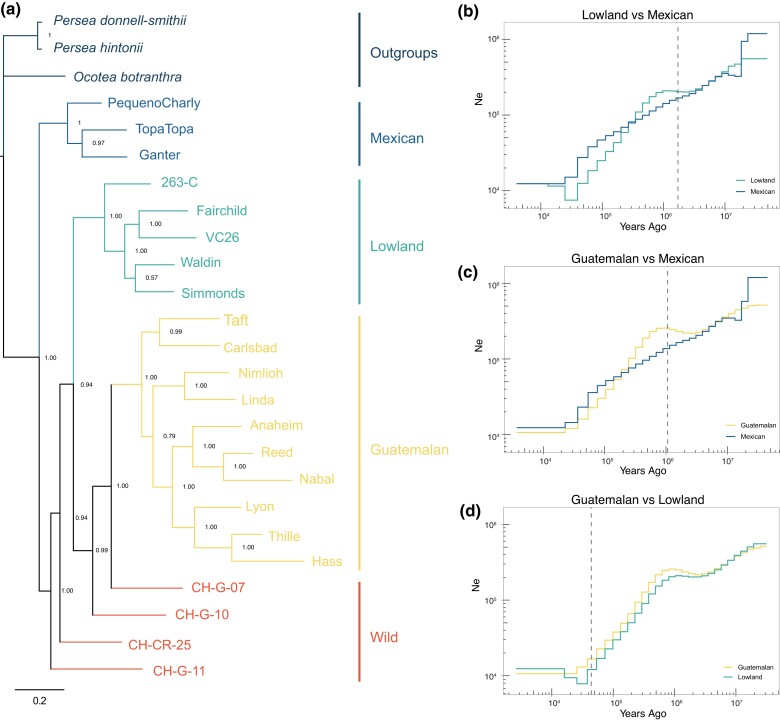
Fig. 3.
a) Genome-wide phylogeny of P. americana ingroup with 3 species outgroups. Accessions were chosen if they had 80% of higher assignments to a race, including putatively wild accessions (CH-G-07, CH-G-10, CH-G-11, and CH-CR-25). The numbers on the nodes represent bootstrap proportions. b) Demographic inference based on the Mexican and Lowland samples. The x-axis represents the time from present to past, and the y-axis is inferred as effective population size (Ne). The vertical dashed lines represented the estimated divergence time between the 2 groups. c) Like b, except for Mexican and Guatemalan samples. d) Like b, except for the Lowland and Guatemalan samples.

