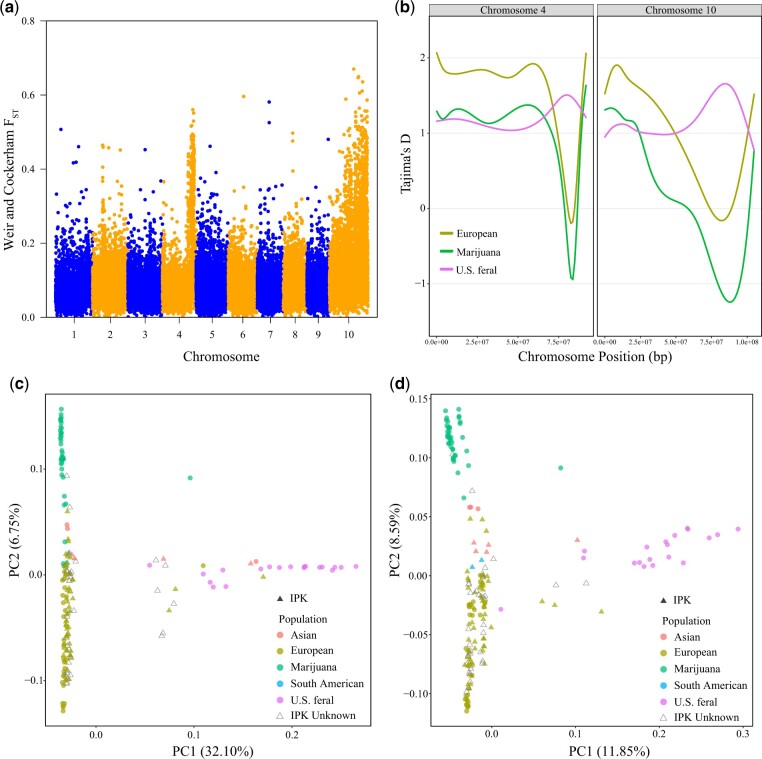
Fig. 2.
Subpopulation divergence on chromosomes 4 and 10. a) Sliding window ST analysis comparing allelic diversity between Marijuana, European and US feral subpopulations. Y-axis points indicate ST scores across 20,000 base pairs. b) LOWESS plots showing Tajima’s D of SCOs plotting against physical positions of chromosomes 4 and 10 (base pairs). Differently colored lines indicate Tajima’s D value for different subpopulations. c) Plot of the first 2 principal components of PCA on all SNPs between 77 and 88 Mb of chromosome 4. d) Plot of the first 2 principal components of PCA on all SNPs identified on chromosome 10.

