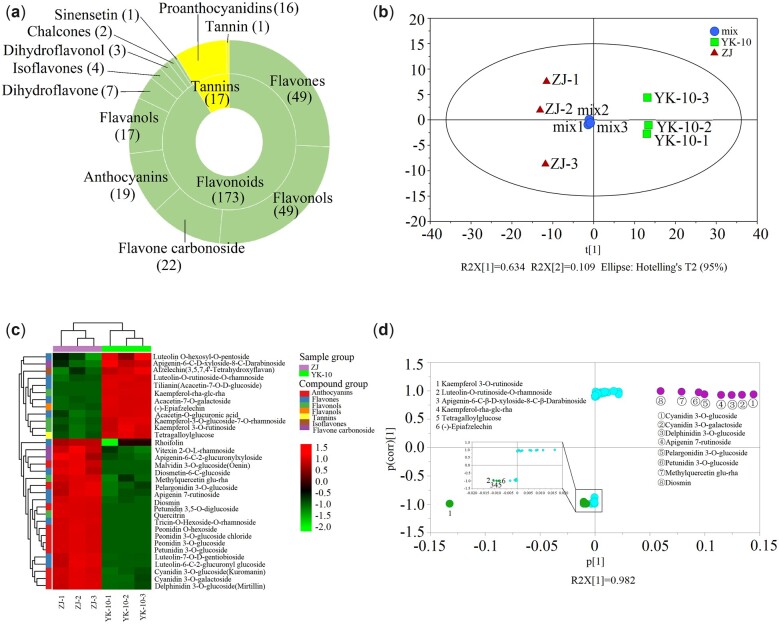
Fig. 2.
Results of metabolomics analysis. Classification of total identified flavonoids (a), PCA scores (b), heatmap (c) and S-plot (d) of 34 DLMs between ZJ and YK-10 shoots. Note: a: the inside circle of concentric circles represent Flavonoids and Tannins, the outside circle represent the classified compounds of Flavonoids and Tannins.

