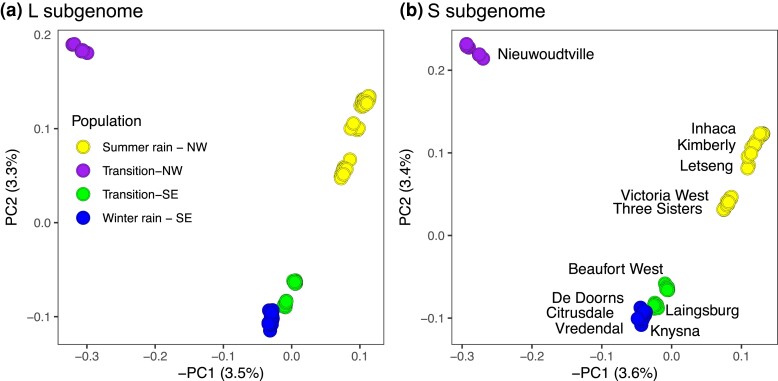
Fig. 3.
Principal components analysis of RRGS data from X. laevis for the (a) L and (b) S subgenomes. For each analysis, the percentages of genotypic variation represented by the first and second principal components (PC1 and PC2, respectively) are indicated. Patterns of population structure are similar in each subgenome and samples cluster by rainfall zone (indicated with color in the left panel) and by locality (labeled in right panel).

