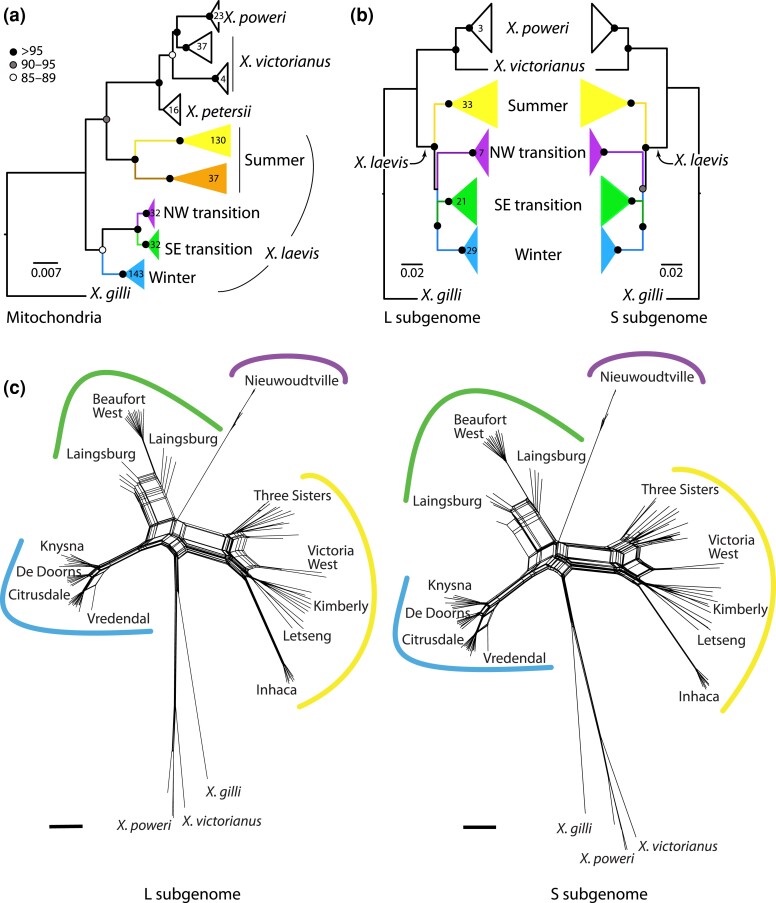
Fig. 5.
Evolutionary relationships among mitochondrial sequences (a) are different from (b and c) the L and S subgenomes. In (a) and (b), black, gray, and white nodes indicate bootstrap values as indicated on the scale; numbers inside clades indicate the sample sizes of individuals; samples sizes of the S subgenome (not shown) are identical to those for the L subgenome. The scale bar indicates substitutions per site for the mitochondrial phylogeny; branch lengths of the phenogram are scaled by only variable positions and are not comparable to mitochondrial branch lengths. Samples in each clade of the mitochondrial tree are listed in Supplementary Table 2. Samples with the brown mitochondrial lineage in (a) were not present in the RRGS data (b). In the Neighbor-Net networks in (c), black bars indicate 0.01 substitutions per site for each subgenome.

