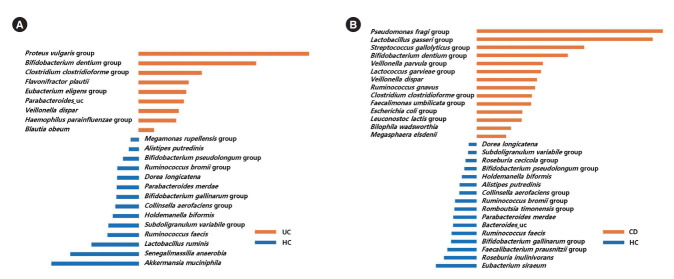
Fig. 4.
Taxa list according to linear discriminate analysis values determined from comparisons between HC and UC patients (A), and between HC and CD patients (B). Effect size estimation analysis identified 9 bacterial taxa that were significantly more abundant in UC patients than HC (A), and 14 bacterial taxa that were significantly more abundant in CD patients than HC. HC, healthy control individuals; UC, ulcerative colitis; CD, Crohn’s disease.

