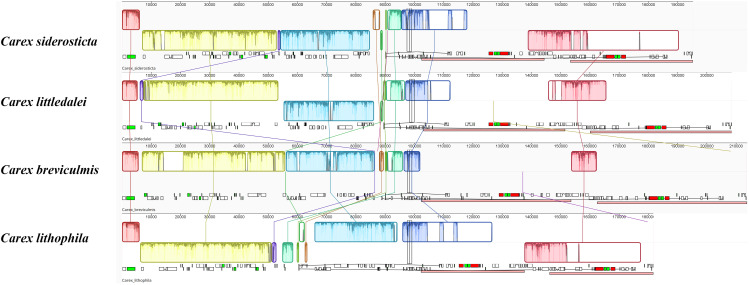
Figure 5.
Mauve alignment of four Carex chloroplast genomes. Complete chloroplast genome sequences were aligned in Geneious using the Mauve algorithm for linear comparison of rearrangements across the Carex. Locally collinear blocks (LCBs) are coloured to indicate syntenic regions. Histograms within each block represent the degree of sequence similarity. Inversions resulting in strand change are represented as offset LCBs (below). The small boxes below each chloroplast genome indicate genes; upper and lower boxes are transcribed counterclockwise and clockwise, respectively. Red boxes indicate ribosomal RNA genes.

